Lesson 2
Short Interest Metrics
Updated Aug 30, 2026 · Reviewed by Terence Scott, founder
- Setup
- Squeeze screening
- Direction
- Analytical
- Timeframe
- Reference
- Key inputs
- SI % float, days to cover, borrow fee, utilization
- Complexity
- Beginner
On this page
Short squeeze setups are unusual among trading setups in that the fuel is directly measurable: you can look up, for any stock, roughly how large the bet against it is and how hard that bet would be to unwind. This guide covers the four metrics that matter, where the data actually comes from, and the reporting quirks that trip up beginners.
Short Interest — and % of Float
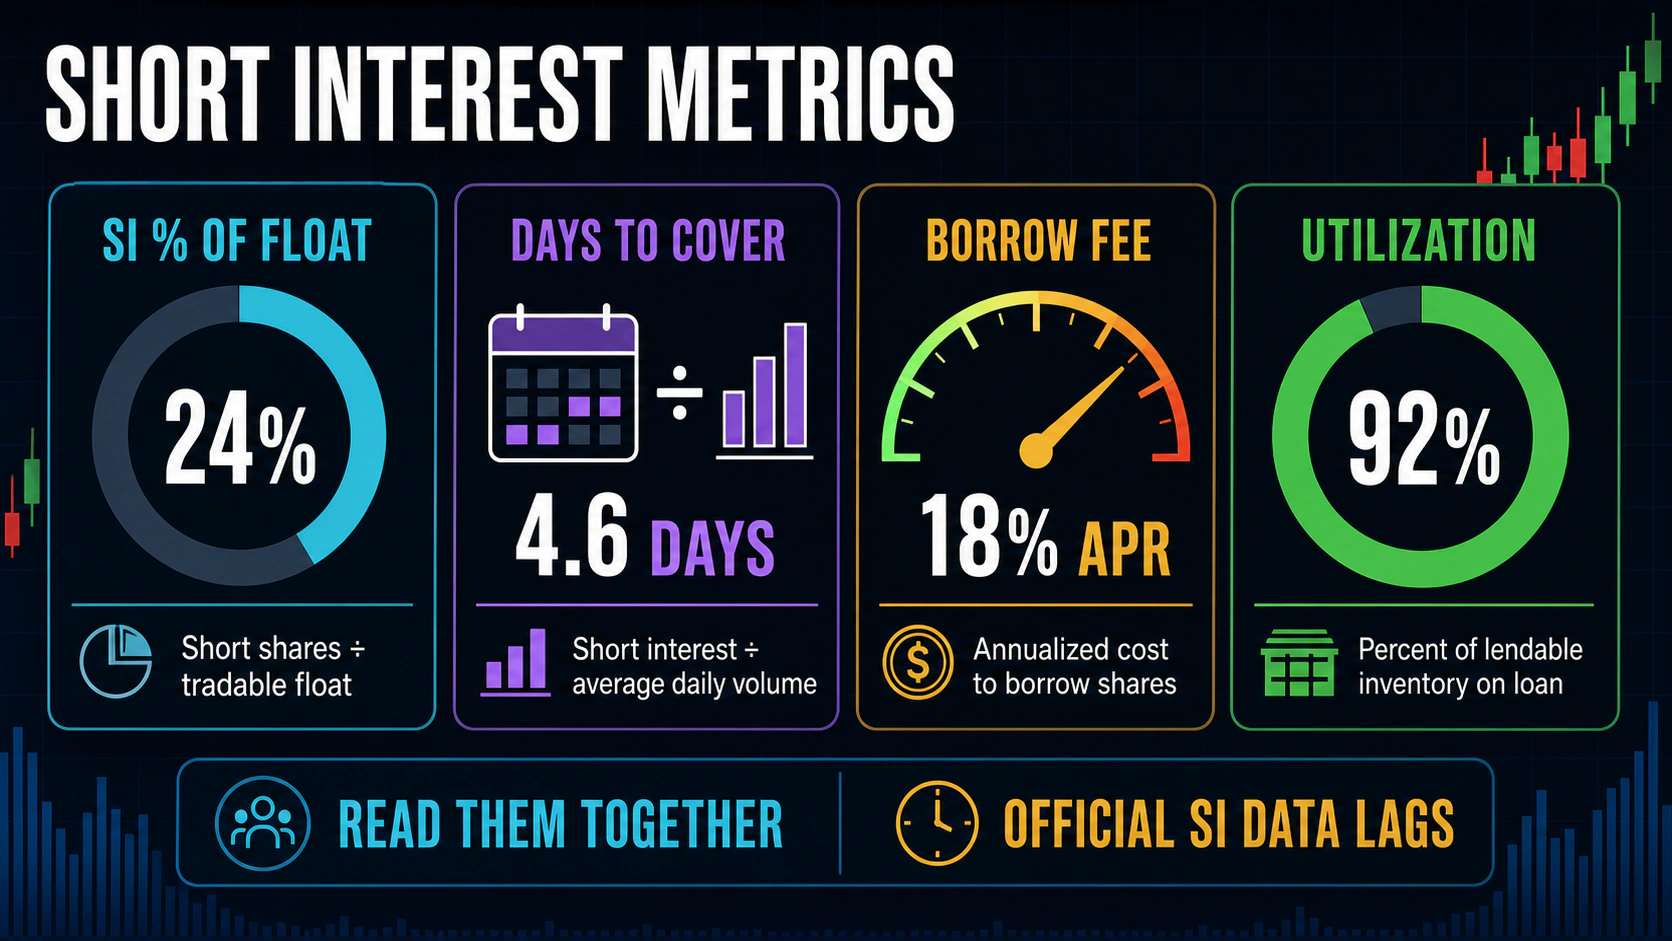
Short interest is the total number of shares currently sold short. The raw number means little by itself — 10 million shares short is enormous for a small company and a rounding error for Apple — so it is almost always expressed as a percentage of something:
- % of float — short interest divided by the shares actually available to trade (excluding insider stakes and other locked-up holdings). This is the number that matters for squeezes, because the float is the pool shorts must buy back from.
- % of shares outstanding — divided by all shares in existence. Always lower than % of float, and a common source of apples-to-oranges confusion when comparing sources.
As rough rules of thumb: most large caps carry short interest in the low single digits of float; above ~10% is elevated; above ~20% is heavily shorted, the territory where squeezes become structurally possible. In rare cases short interest can exceed 100% of float — legally, since a borrowed-and-sold share can be borrowed and sold again by its new owner — which is what made GameStop in 2021 so combustible.
Days to Cover
Days to cover (also called the short-interest ratio) is short interest divided by average daily trading volume:
Days to cover = shares short ÷ average daily volume
It answers the question crowding alone can't: how narrow is the exit? Twenty million shares short in a stock trading fifty million shares a day can unwind quietly in an afternoon. The same short position in a stock trading two million shares a day needs ten full days of all the volume — and in practice, covering that size moves the price against the shorts the whole way.
Below 2 is unremarkable; mid single digits is meaningful; approaching 10 or more, the exit is genuinely narrow. Note the metric's built-in quirk: volume explodes during an actual squeeze, so days to cover falls right as the squeeze happens. It is a setup-screening metric, not a live squeeze-meter.
Borrow Fee and Utilization
Two lending-market metrics complete the picture:
- Borrow fee (cost to borrow) — the annualized interest rate a short pays to borrow shares. Easy-to-borrow large caps cost well under 1%; crowded or scarce names can run to double- or even triple-digit annualized rates. A high borrow fee is constant pressure on shorts to close, catalyst or not — time itself works against them.
- Utilization — the fraction of lendable shares already lent out. At or near 100%, there are essentially no shares left to borrow: new shorts can't easily enter, and existing shorts risk having their borrow recalled, forcing them to buy back regardless of price.
High short interest with a high borrow fee and near-full utilization is a materially tighter setup than high short interest alone — it means the crowding has already strained the plumbing.
Where the Data Comes From — and Its Lag
The reporting details matter more than beginners expect:
- Official short interest is reported by brokers to FINRA twice a month, as of mid-month and end-of-month settlement dates, and published several business days after each. The authoritative number is therefore always one to three weeks stale — a stock can be squeezed and round-tripped entirely between two reports.
- Daily estimates of short interest, borrow fees and utilization are produced by data vendors from securities-lending flows. They are estimates, not filings, but they are current — which is why serious squeeze screening uses both: filings for the level, lending data for the trend.
- Daily short volume (the fraction of a day's trades tagged short-exempt/short) is published daily and often quoted, but it measures trading flow, not open positions — a market maker shorting and covering intraday inflates it. It is not short interest, despite frequently being confused for it.
Reading the Metrics Together
| Profile | Reading |
|---|---|
| SI 25% of float, days to cover 8, borrow fee 40%, utilization 98% | Textbook squeeze powder keg — crowded, narrow exit, expensive to hold, no borrow left. Still needs a spark. |
| SI 22% of float, days to cover 1.5, borrow fee 0.5% | Crowded but liquid and cheap to hold — shorts can leave gracefully. Much weaker setup. |
| SI 4% of float, stock rallying hard | Not a squeeze — just a rally. The "squeeze" label needs the crowding to mean anything. |
One caution cuts across all of it: heavily shorted stocks are usually heavily shorted for a reason. Short sellers as a group are informed traders, and most heavily-shorted companies underperform. The metrics identify stored energy, not merit — which is why the trading approach in how to trade a short squeeze leans so heavily on confirmation and risk control.
Screening Without the Spreadsheet
Our short-squeeze scanner combines these ingredients — short interest, days to cover, and a confirming technical setup — into a single daily ranked list, and the high short interest screen gives the raw universe sorted by crowding. For the mechanics these metrics feed into, start with what a short squeeze is.