Lesson 6
How to Read a Stock Quote
Updated Sep 2, 2026 · Reviewed by Terence Scott, founder
- Price Trio
- Last, Bid, Ask
- Activity
- Volume vs average
- Valuation
- Market cap, P/E, EPS
- Context
- 52-week range
- Income
- Dividend yield
- Level
- Beginner
On this page
A stock quote packs a dozen numbers into one small box, and each answers a different question: what does it cost, how busy is it, what is the whole company worth, what am I paying for its earnings, and where has it been? This lesson decodes them in the order a practiced eye reads them. Open any name on our stock quotes page and follow along with live numbers.
The Price Trio: Last, Bid, Ask
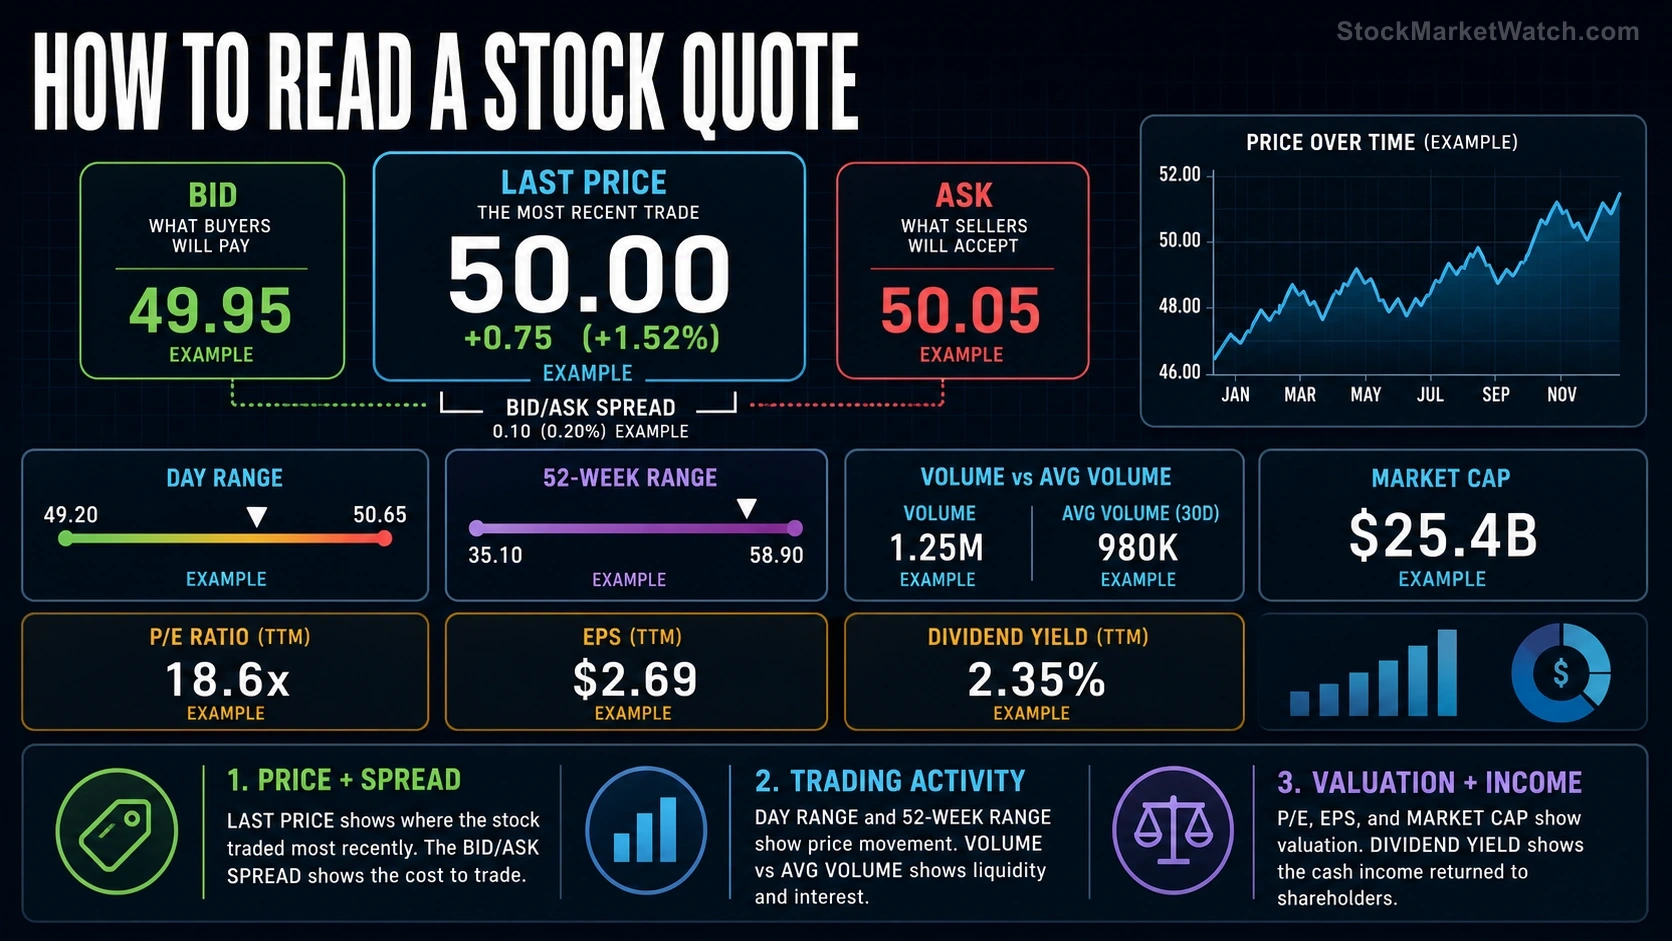
Last is the price of the most recent trade — the headline number, plus the day's change in dollars and percent against yesterday's official close. Remember it's history, even if only milliseconds old. The actual market right now is the bid (highest current buyer) and ask (lowest current seller) from lesson 3. A tight spread — pennies — means cheap, easy trading; a wide one is the market telling you this stock is expensive to transact, whatever its price.
Volume — and the Only Way to Read It
Volume is shares traded today; on its own it means little. It becomes information next to average volume (typically a 3-month daily average): a stock trading 4× its average is having an event — news, earnings, a big move drawing attention — while 0.3× is a stock nobody's watching today. Every scan on our movers pages leans on this ratio, because unusual volume is the most honest footprint that something real is happening.
Size and Valuation: Market Cap, EPS, P/E
- Market cap — share price × shares outstanding: what the market prices the entire company at. It's the number that makes prices comparable — a $900 stock isn't "more expensive" than a $9 one in any meaningful sense; the market caps tell you which business the market values more.
- EPS (earnings per share) — the company's profit divided across its shares, usually shown for the trailing twelve months.
- P/E ratio — price ÷ EPS: how many dollars you pay for each dollar of annual earnings. It's the market's shorthand for expectations — high P/E means high hopes priced in, low P/E means skepticism (sometimes deserved, sometimes an opportunity — the entire debate of the stock-picking course). A blank or "N/A" P/E usually means no profits to divide by, which is itself worth knowing.
Context: the 52-Week Range
The 52-week high and low bracket where today's price sits in its own recent history. Near the high often marks strength (and features in momentum strategies); near the low marks either a bargain or a business problem — the number can't tell you which, only that the question exists. Our signal scans track names breaking out to fresh 52-week levels daily, because those crossings are where the two interpretations get settled in public.
Income: Dividend and Yield
If the company pays a dividend, the quote shows the annual amount and the yield — dividend ÷ price. Two cautions: yield rises mechanically when price falls, so an unusually fat yield is often a warning label rather than a gift; and the ex-dividend date decides who gets the next payment — buy on or after it and the seller keeps that one.
The Session Extras
Open, day high/low, and previous close frame today's action. When the open sits far from the previous close, you're looking at a gap — overnight news repriced the stock before regular trading began (our premarket page catches these forming). Outside regular hours, quotes show after-hours or premarket prices — thinner markets, wider spreads, and moves that sometimes partially reverse at the open, so read extended-hours prints as a first draft, not a verdict.
A 15-Second Read, in Practice
Pull up a quote and run the practiced sequence: Price and change — what's happening today. Volume vs average — is today unusual? 52-week range — where are we in the bigger story? P/E — what expectations am I paying for? Yield — is income part of the deal? Fifteen seconds, five questions, and you know whether this quote deserves the next fifteen minutes.
The quote tells you what; the chart tells you how it got there — reading stock charts is next.