Lesson 3
Growth Investing
Updated Sep 2, 2026 · Reviewed by Terence Scott, founder
- Core Idea
- Compounding beats cheapness
- Key Metrics
- Revenue & EPS growth, TAM, margins
- Main Cost
- High valuations
- Main Hazard
- Growth decelerating
- Level
- Intermediate
On this page
Growth investing bets on the arithmetic of compounding: a business growing earnings 25% a year doubles them roughly every three years, and if the growth persists, today's scary-looking valuation gets quietly rescued by the future. Where the value investor asks "what is this worth today?", the growth investor asks "what will this become?" — and is willing to pay a premium now for the answer.
The Core Logic
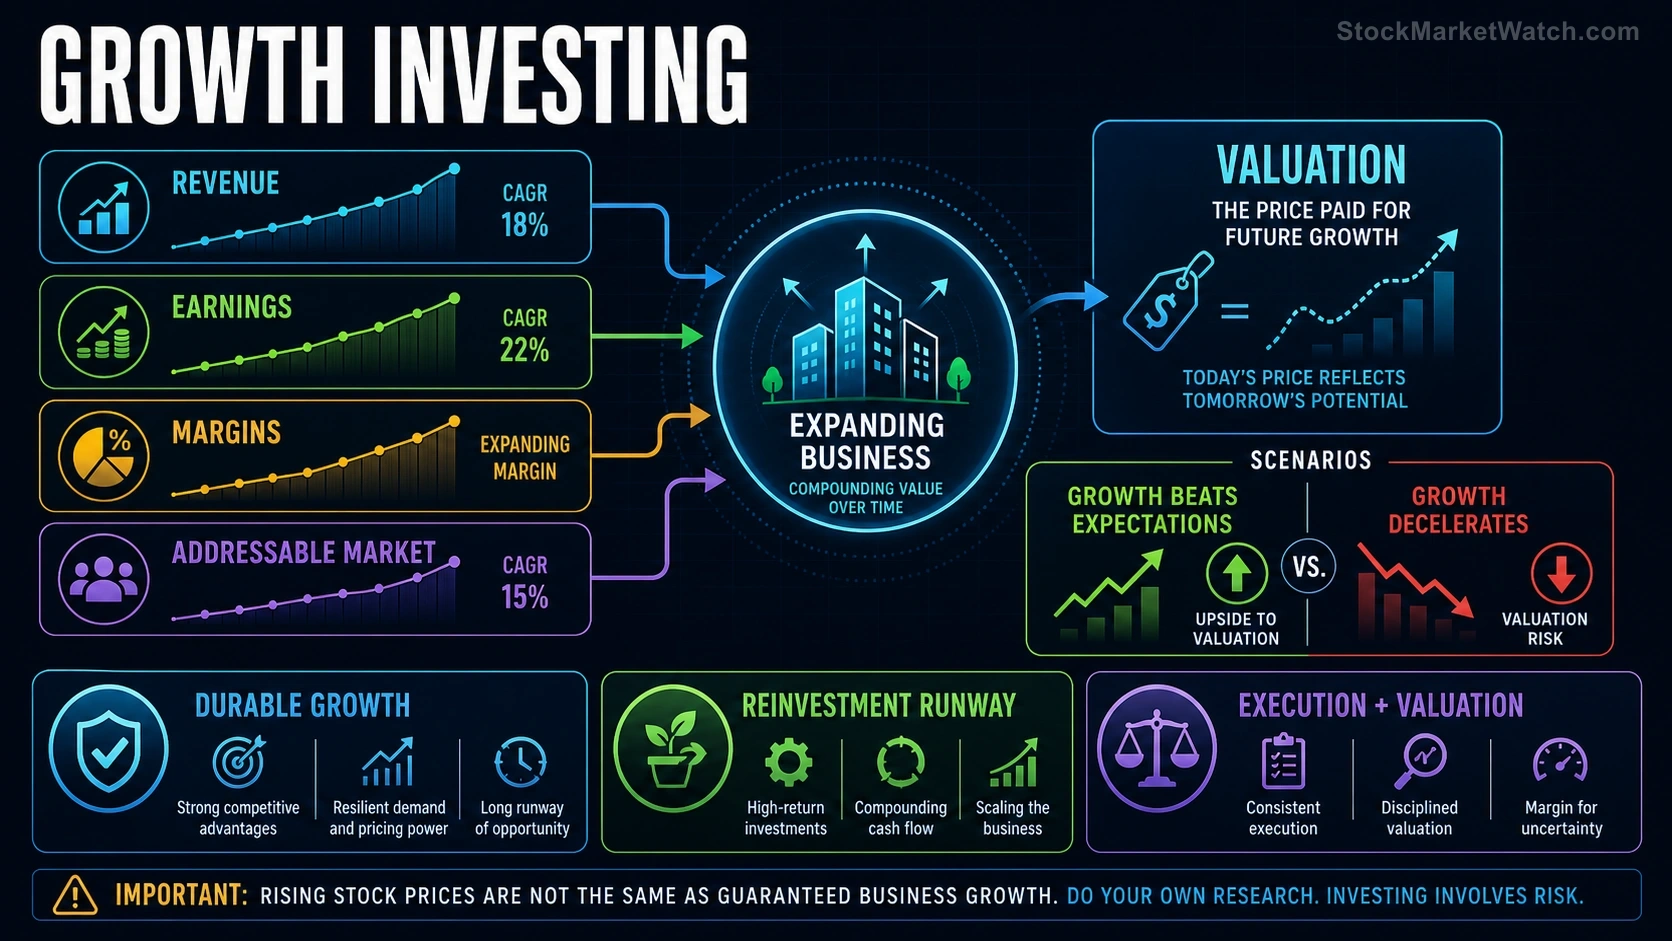
Most of the stock market's great fortunes were made not by buying cheap companies but by holding extraordinary ones for a long time. A stock at 40× earnings looks expensive against the market's average — but if earnings triple over six years, the buyer effectively paid 13× tomorrow's earnings for a business proving it can compound. Growth investing is the deliberate search for those compounders, accepting valuation risk as the entry fee. The strategy's honest summary: time is the friend of the wonderful business — and the enemy of the investor who overpaid for an ordinary one.
What the Screen Looks Like
- Revenue growth first — 15–20%+ sustained, because revenue is the growth that can't be manufactured by cost-cutting
- Earnings (or clear path to them) — accelerating EPS, or for younger companies, improving margins that show the model scales
- A big addressable market (TAM) — room to keep compounding; a fast grower in a small pond decelerates on schedule
- High returns on capital and reinvestment runway — the engine of compounding is reinvesting profits at high rates, not hoarding them
- A moat forming — growth attracts competition; the question from lesson 1 (what stops rivals?) matters doubly here
The Price of Admission: Valuation Risk
Growth stocks are priced on expectations stacked on expectations, which produces two structural hazards:
- Deceleration is the killer, not failure. A growth stock rarely collapses because the business breaks; it collapses because growth slows from 40% to 20% — still excellent, but less than the price assumed. The stock can fall 50% while the company keeps growing. This is the expectations mechanism from the basics course at maximum voltage.
- Rates hit growth hardest. The further in the future the profits, the more today's value depends on the discount rate — which is why rising interest rates historically compress growth valuations more than value's (2022 being the era's textbook demonstration).
Drawdowns of 30–60% in individual growth names are a feature of the category, not a sign of doing it wrong. The strategy's returns have historically been earned by those who could hold through them — and destroyed for those who bought the euphoria and sold the compression.
Growth Disciplines That Separate Investors From Tourists
- Follow the growth, not the story. Quarterly reports either confirm the thesis with numbers or they don't; a narrative that survives three quarters of decelerating revenue is a mascot, not a thesis.
- Size for the volatility. Positions sized so a 40% drawdown is tolerable are positions that can be held long enough to compound.
- Watch what expectations already assume. The P/E from the quote page is the market's growth forecast in disguise; the GARP lesson next turns that into an explicit tool.
- Sell on thesis break, not on price. The expensive mistakes in growth are symmetric: selling a compounder because it doubled, and holding a decelerator because it's down.
Who the Strategy Fits
Growth suits investors with long horizons, tolerance for violent marks against them, and genuine interest in businesses and their industries — the research is more about products, competition and markets than balance-sheet forensics. It fits poorly with tight timelines and with temperaments that read every 30% drawdown as information. For a systematized, rules-based cousin that adds timing and market filters to growth criteria, see CAN SLIM later in this course.
Running It Live
Our screens sort the market by growth and performance measures, and the signal scans track the momentum behaviors — 52-week highs, relative strength — where market leaders tend to announce themselves. Growth candidates usually aren't hiding: they're the names making new highs while their industries make headlines. The discipline is everything that comes after finding them.