Triangle Pattern (Ascending)
Updated Aug 26, 2026
- Signal
- Bullish
- Reliability
- High
- Volume Confirmation
- Required
- Market Conditions
- Works best in trending markets
On this page
Ascending Triangle is a bullish continuation pattern that forms when price makes a series of higher lows against a flat resistance level. The rising lows show buyers becoming more aggressive over time, while the flat top shows a specific resistance level that sellers keep defending — until, typically, they can't anymore.
What Is an Ascending Triangle?
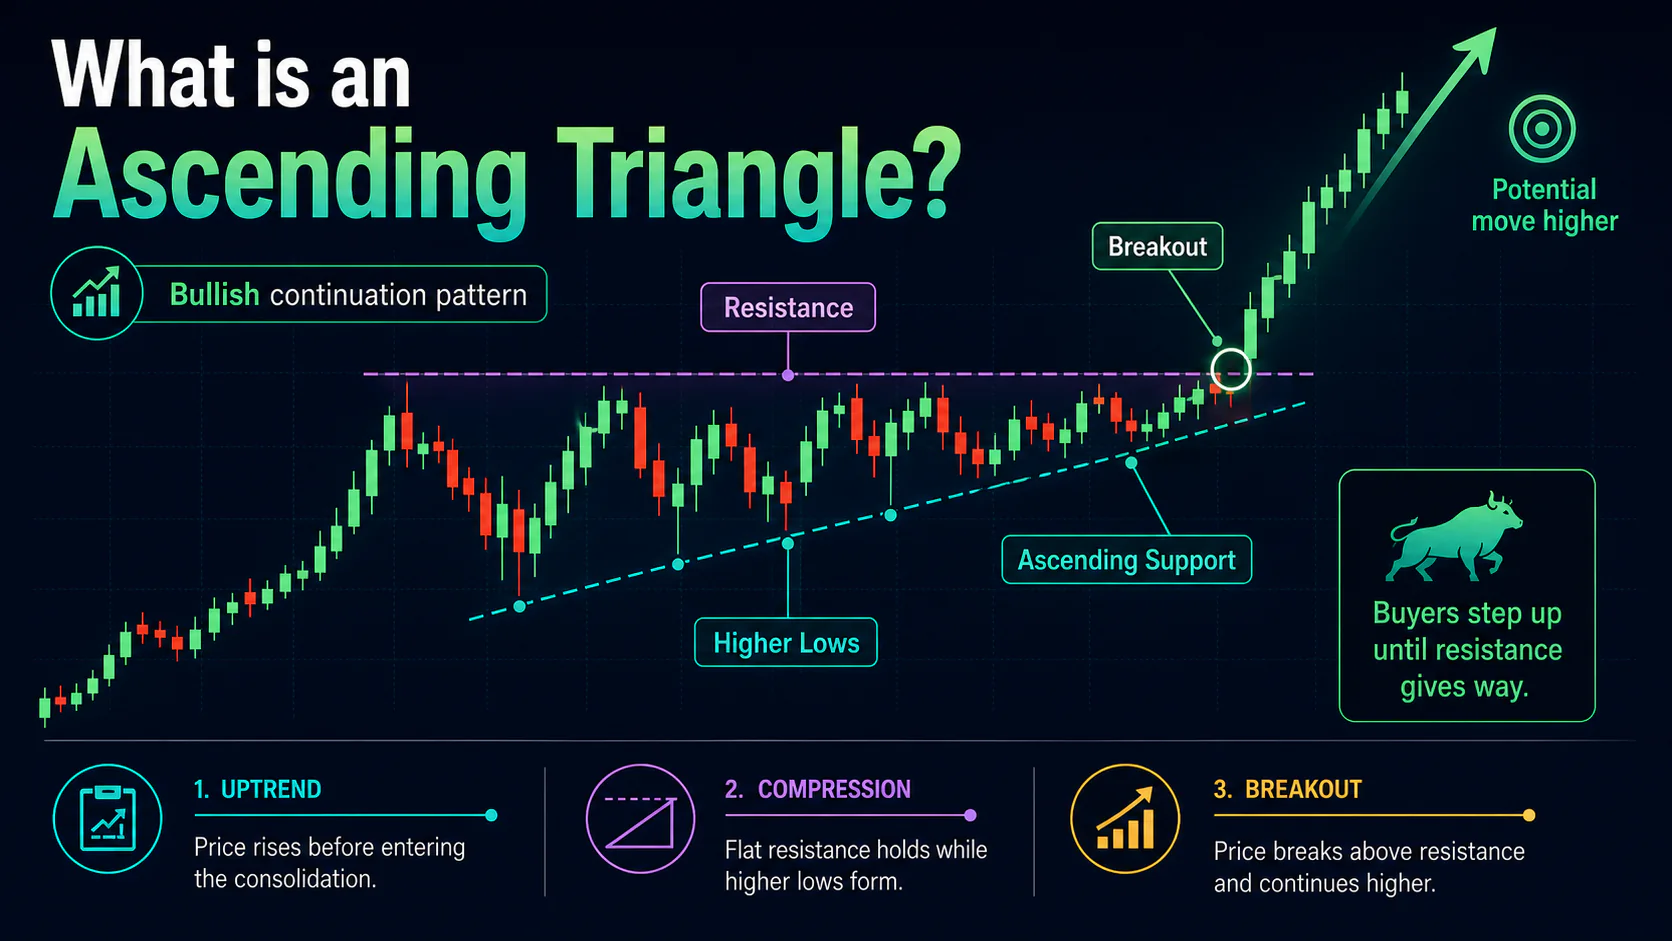
The pattern is bounded by a horizontal resistance line connecting two or more swing highs and an upward-sloping support line connecting a series of higher lows, forming a triangle that narrows as the two lines converge. A close above resistance, ideally on volume clearly above average, signals a likely continuation of the prior uptrend. The breakout usually occurs before price actually reaches the apex where the two lines would meet — often once the range has narrowed considerably but with some room left to run.
Key Uses
- Trend Continuation Confirmation: Signals continuation of an existing uptrend
- Resistance Analysis: Identifies a key level through repeated tests and an eventual break
- Defined Entries and Stops: The resistance breakout and ascending support line give clear entry and risk levels
- Target Calculation: The triangle's widest height gives a measured-move target
Anatomy of the Pattern
Horizontal Resistance: A flat line connecting two or more swing highs, often at a round number or a previously significant level. It typically becomes support after a successful breakout.
Ascending Support: An upward-sloping trendline connecting a series of higher lows, showing that buyers are willing to step in at progressively higher prices as the pattern develops.
Breakout Point: A decisive close above the horizontal resistance, ideally with an expansion in volume, that triggers the measured-move target.
Volume Confirmation
Volume generally declines as the pattern develops, reflecting the equilibrium between buyers defending higher lows and sellers defending the flat top. Volume on the resistance tests typically shrinks over successive attempts — a sign that sellers are running out of conviction — while the breakout itself should come on a clear expansion of volume, ideally the largest single-day volume of the entire formation, with continued above-average volume in the sessions that follow.
Pattern Variations
Right-Angled Ascending Triangle: A clean, textbook version with a sharply horizontal resistance line and a well-defined rising support line — generally the easiest variant to identify and trade.
Ascending Triangle With a Slight Slope: In practice, the resistance line often has a small upward or downward tilt rather than being perfectly flat. A gentle upward tilt is still considered bullish (arguably more so); a gentle downward tilt can still qualify as long as the support line is rising faster than resistance is falling.
False Breakout: Occasionally an initial move above resistance fails and price returns into the pattern before a genuine breakout follows later, on higher volume, at the same level.
Trading Strategies
Breakout Entry: Wait for a decisive close above resistance with volume clearly above average, then enter long on the break or a slight pullback to the resistance level. Place a stop below the most recent swing low (tighter) or below the ascending support line (more conservative). The minimum target is the triangle's widest vertical height projected upward from the breakout point.
Support Bounce Entry: More experienced traders sometimes enter on a bounce off the ascending support line, using a reversal candle and supporting volume as confirmation. This allows tighter stops and multiple entry opportunities as the pattern develops, but the pattern remains unconfirmed until the resistance actually breaks.
Retest Entry: After an initial breakout, price sometimes returns to test the old resistance as new support. Entering on a successful retest with supporting volume offers a well-defined stop just below that level.
Combining With Other Analysis
A resistance level that lines up with a prior significant high or a round number carries more weight, and support from a rising major moving average (the 50-day or 200-day are common references) reinforces the case for a bullish resolution. The RSI making higher lows through the pattern, mirroring price, adds confirmation, and a push above 50 on the breakout supports the case for genuine momentum rather than a false move. Fibonacci retracement levels can help anticipate where support bounces are likely to occur.
Failed Pattern Recognition
The clearest failure signal is a breakdown below the ascending support line on strong volume, particularly after multiple false breakout attempts above resistance failed to hold. A failed Ascending Triangle can reverse sharply and may signal the end of the prior uptrend rather than a pause within it, so a decisive break of support is worth treating as a real trend change rather than noise.
Common Mistakes
Calling the pattern too early: Identifying a triangle before there are at least two touches of resistance and a few touches of the rising support line.
Skipping the volume check: Trading a breakout without confirming a genuine expansion in volume.
Chasing the breakout: Entering well after the move has already extended, rather than on the initial break or a subsequent retest.
Ignoring market context: Trading the pattern against the broader trend without additional confirmation.
FAQs
How reliable is the Ascending Triangle pattern?
It's generally considered one of the more dependable continuation patterns, and reliability improves when it forms within an established uptrend, shows the expected declining-volume signature during formation, and breaks out on a clear volume expansion. As with any chart pattern, it works best combined with trend and volume context rather than traded on shape alone.
What's the difference between Ascending and Descending Triangles?
An Ascending Triangle has flat resistance and rising support and is typically bullish; a Descending Triangle has flat support and falling resistance and is typically bearish. The volume and psychology are mirrored between the two.
How do you calculate price targets?
Measure the vertical distance from the base of the triangle to the resistance line, then project that same distance upward from the breakout point. That's the minimum measured-move target; prior resistance levels can serve as secondary targets.
Can Ascending Triangle patterns fail?
Yes, when price breaks down below the ascending support line instead of breaking out above resistance. Failed patterns can lead to sharp reversals and sometimes signal the end of the prior uptrend.
What volume pattern confirms an Ascending Triangle?
Volume should generally decline during formation, then expand clearly on the breakout, with continued above-average volume in the sessions that follow.
What's the best entry point?
The most conservative entry is a decisive close above resistance with volume confirmation; more active traders sometimes enter on bounces off the ascending support line, while patient traders wait for a pullback that retests broken resistance as support.
Conclusion
Ascending Triangle gives traders a clear, geometry-based setup: flat resistance, rising support, and a breakout that typically continues the prior uptrend. Its value lies in the combination of a well-defined resistance level, a rising support line that shows building demand, and volume confirmation on the eventual break — used together, they give a disciplined framework for trading continuation moves within an uptrend.