Triple Bottom Pattern
Updated Aug 26, 2026
- Signal
- Bullish
- Reliability
- Very High
- Volume Confirmation
- Required
- Market Conditions
- Works best in trending and bottoming markets
On this page
Triple Bottom is a bullish reversal pattern that forms when price tests the same support level three times after a downtrend, separated by two intermediate rallies. It works on the same logic as a Double Bottom, but the extra test of support gives an additional layer of confirmation before the pattern completes.
What Is a Triple Bottom?
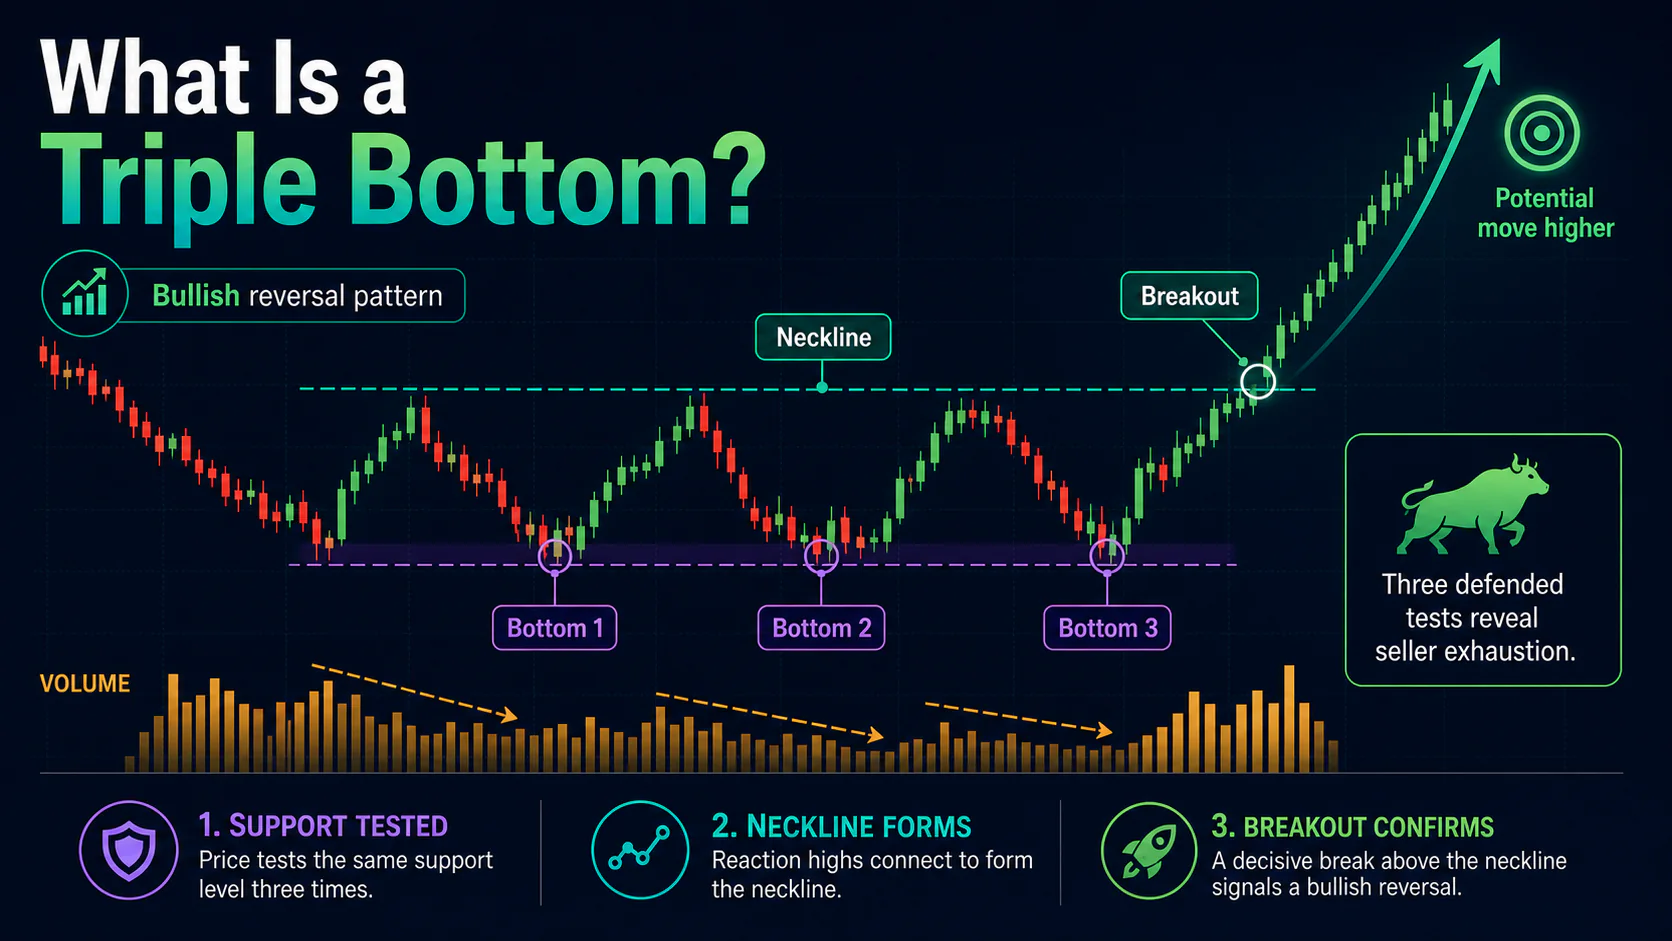
The pattern consists of three lows at approximately the same level, with two intervening rallies that, once connected, form the neckline (resistance). A decisive close above the neckline confirms the pattern and signals a shift from a downtrend to an uptrend. Each failed attempt to push price below support chips away at seller conviction; by the third test, buyers are typically defending the level more aggressively than they did on the first two attempts, and volume on that third low is often the lightest of the three.
Key Uses
- Trend Reversal Identification: Signals the end of a downtrend
- Bottom Recognition: Helps identify major market bottoms
- Defined Entries and Stops: The neckline break and pattern lows give clear entry and risk levels
- Target Calculation: Pattern height gives a measured-move target
Anatomy of the Pattern
First Low: The initial test of support following the downtrend, typically on heavy volume as selling reaches a climax.
First Rally: A recovery from the first low that establishes the first point of the neckline.
Second Low: A second test of the same support, ideally on lighter volume than the first — an early sign that selling pressure is fading even before the pattern is confirmed.
Second Rally: A recovery from the second low, forming the second neckline point. This rally may reach near or slightly above the first rally's high.
Third Low: The final and most decisive test of support, typically on the lightest volume of the three lows. A clear bounce here confirms the support level is holding firm.
Volume Confirmation
The classic signature is volume declining progressively across the three lows — heaviest on the first, lighter on the second, lightest on the third — while price makes roughly equal lows each time. That divergence between flat price and falling volume is the core bullish signal. The neckline breakout should occur on volume clearly above the recent average, ideally exceeding the volume seen at any single low in the pattern; a breakout on thin volume is more likely to fail or require a retest before continuing higher.
Pattern Variations
Symmetrical Triple Bottom: Three lows evenly spaced in time with rallies of similar height — often considered the cleanest and most straightforward variation to trade.
Ascending Triple Bottom: Each successive low is slightly higher than the last, showing progressively building buying support even before the neckline breaks.
Complex Triple Bottom: Occasionally the formation includes additional minor tests beyond the core three lows, extending the timeline. If instead a Double Bottom fails to break its neckline and a third test of support follows, the pattern becomes a Triple Bottom rather than reverting to trend.
A Double Bottom is the two-low version of this same setup, and the Inverse Head and Shoulders is a related three-low reversal where the middle low is distinctly the deepest rather than level with the others.
Trading Strategies
Breakout Entry: Wait for a decisive close above the neckline with volume clearly above average, then enter long on the break or a modest pullback to the neckline. Place a stop below the lowest of the three bottoms. The minimum target is the pattern height (bottom to neckline) projected upward from the breakout point.
Third-Bottom Entry: More experienced traders sometimes enter long as the third low forms and shows declining volume with a clear bounce. This offers a better risk-reward ratio with a stop below the support zone, but the pattern isn't confirmed until the neckline actually breaks.
Retest Entry: After the initial breakout, price sometimes pulls back to test the broken neckline as new support. Entering on a successful retest offers a tighter stop and added confirmation of the pattern's validity.
Combining With Other Analysis
A Triple Bottom that forms at a long-standing, historically significant support level carries more weight, and a subsequent reclaim of key moving averages reinforces the case. The RSI and MACD often show progressively higher lows across the three bottoms even as price makes roughly equal lows — a bullish divergence that can precede the neckline break. Fibonacci retracements can help gauge where the intervening rallies are likely to peak.
Failed Pattern Recognition
The clearest failure signal is a breakdown below all three lows on solid volume, which usually means selling pressure has actually returned rather than faded. Extended formations that drag on for many months without a neckline break are also a caution sign. A failed Triple Bottom can decline sharply as long positions built during the pattern's formation get liquidated.
Common Mistakes
Trading too early: Acting before the third low has actually formed and bounced.
Skipping the volume check: Not confirming that volume is declining across the three successive lows.
Weak risk management: Placing stops too close to the entry rather than below the full support zone.
Ignoring market context: Trading the pattern without weighing the broader trend and overall market conditions.
Triple Bottom vs. Other Patterns
Vs. Double Bottom: A Triple Bottom requires a third test of the same support, which in principle offers more confirmation than a Double Bottom's two tests, at the cost of a longer formation period.
Vs. Head and Shoulders Bottom: An Inverse Head and Shoulders has three lows with the middle one distinctly deeper (the head); a Triple Bottom has three lows at roughly the same level.
Vs. Rounding Bottom: A rounding bottom is a gradual, saucer-shaped accumulation with no sharply defined lows, while a Triple Bottom has three clearly identifiable troughs and a well-defined neckline.
FAQs
How reliable is the Triple Bottom pattern?
The extra test of support generally gives it more confirmation than a Double Bottom, and reliability improves further when the pattern forms after an extended downtrend with volume declining across the three lows. As with any chart pattern, it works best alongside broader trend and volume context rather than in isolation.
What's the difference between a Triple Bottom and a complex bottom?
A Triple Bottom specifically requires three distinct tests of the same support level. A complex bottom may include additional minor tests or a longer formation period while retaining the same core structure.
How do you calculate price targets?
Measure the vertical height from the bottoms to the neckline, then add that distance to the point where the neckline breaks. That's the minimum measured-move target.
Can Triple Bottom patterns fail?
Yes, when price breaks below all three lows on strong volume. Failed Triple Bottoms are less common than failed Double Bottoms given the extra confirmation, but they do happen and can lead to sharp declines.
What volume pattern confirms a Triple Bottom?
Volume should decline progressively across the three lows, with the neckline breakout occurring on volume clearly above the recent average.
What's the best entry point?
Conservative traders wait for a volume-confirmed neckline break; more active traders sometimes enter on the third-bottom bounce with a stop below the support zone.
Conclusion
Triple Bottom extends the logic of a Double Bottom with a third test of support, giving traders extra confirmation before committing to a long position. Its value comes from the combination of a well-defined support zone, declining volume across the three lows, and a clear neckline trigger — used together, they provide a disciplined framework for spotting when a downtrend has genuinely run out of sellers.