Price Channel (Descending)
Updated Aug 26, 2026
- Signal
- Bearish
- Reliability
- High
- Volume Confirmation
- Preferred
- Market Conditions
- Works best in trending markets
On this page
A descending price channel forms when price declines between two parallel, downward-sloping trendlines: an upper line connecting a series of lower highs (resistance) and a lower line connecting a series of lower lows (support). Unlike a triangle or wedge, the two lines stay roughly the same distance apart rather than converging, so the channel can persist for weeks or months as long as price keeps respecting both boundaries. This guide covers how to trade within the channel, how to read a break of either line, and how to set realistic targets.
What Is a Descending Price Channel?
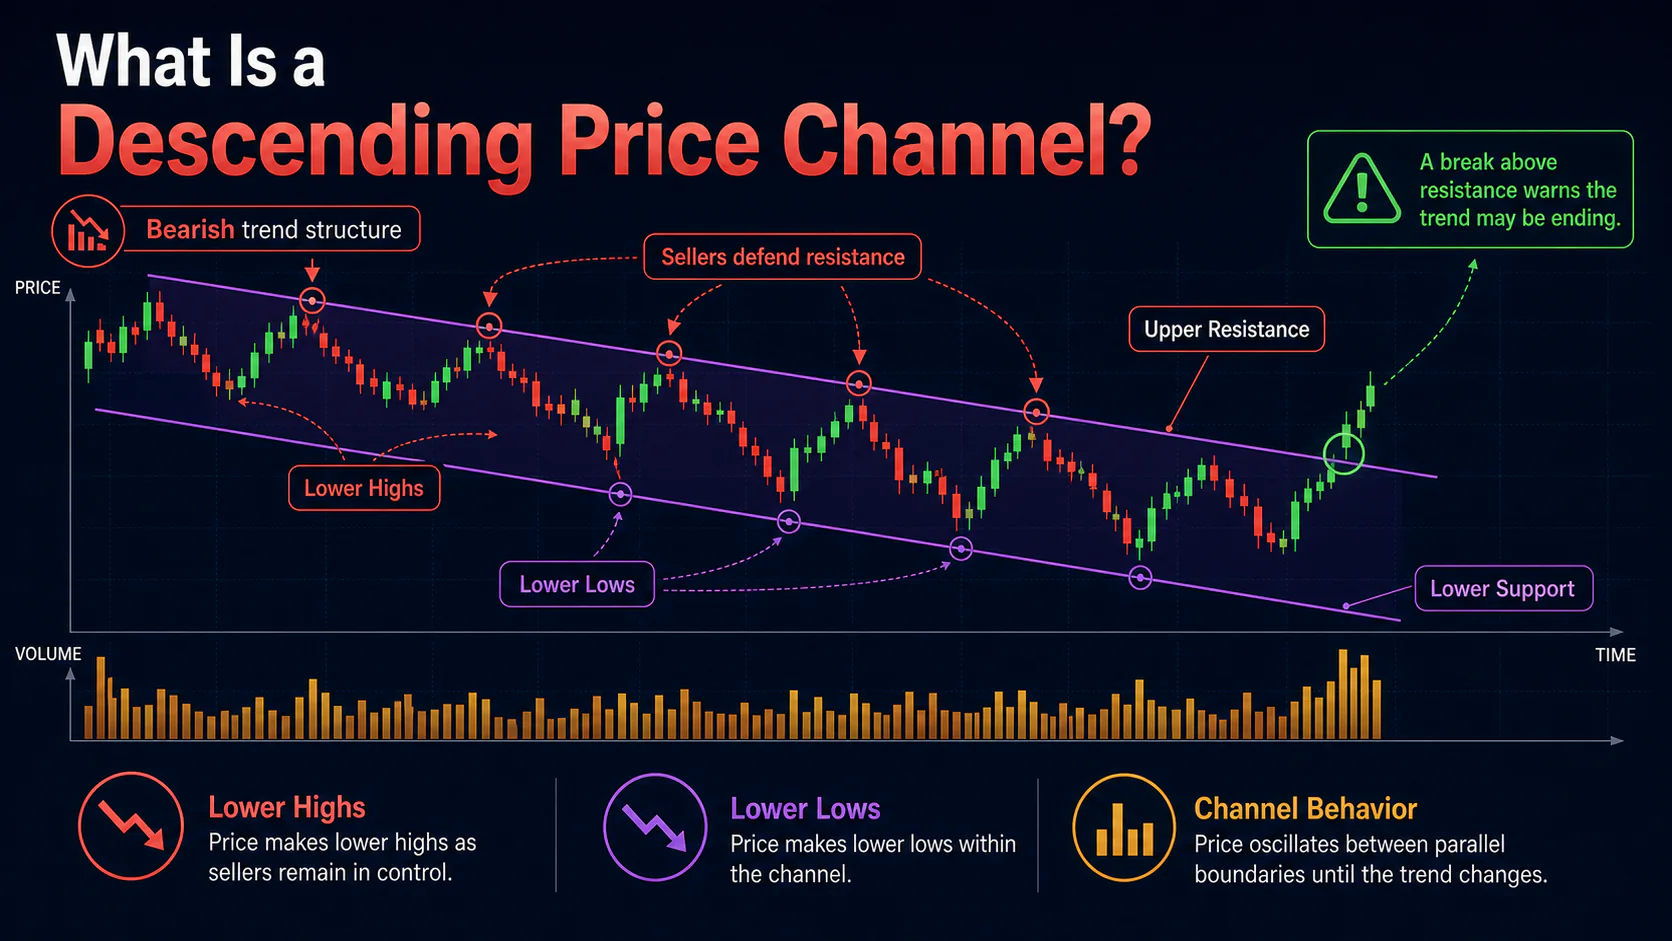
The pattern reflects a market in a fairly orderly downtrend: sellers consistently step in near the upper trendline, and buyers cover shorts or bargain-hunt near the lower trendline, without either side overwhelming the other. That back-and-forth is what keeps the channel's width roughly constant. As long as the upper line holds, the channel is treated as a bearish continuation structure; a decisive break of that upper line is the standard warning that the downtrend itself may be ending, since it means sellers failed to defend the line that had been capping every prior rally.
Anatomy of the Pattern
Upper Trendline (Resistance)
- Connects a series of lower highs
- The line that defines the trend — a decisive close above it is the key reversal warning
- Should show at least three or four clear touches to be considered reliable
Lower Trendline (Support)
- Connects a series of lower lows, roughly parallel to the upper line
- Acts as a near-term area for short-covering bounces within the downtrend
Channel Width
- The vertical distance between the two lines should stay fairly consistent
- A widening channel suggests increasing volatility; a narrowing one often precedes either an acceleration or a failure of the trend
Pattern Psychology
Each rally to the upper line attracts sellers who see the bounce as an opportunity within an intact downtrend, which is what produces the rejection and the next lower high. Each approach to the lower line draws some short-covering from short-term traders, which cushions the decline without derailing the broader trend. Volume typically expands on rejections from resistance — confirming that sellers are actively defending the line — and should contract on rallies within the channel, since a lack of buying pressure on those bounces is what validates the trend's health. A decisive break of the upper line, especially on a pickup in volume, signals that this sell-the-rally behavior has broken down.
Trading the Channel
1. Selling Resistance
The core approach: sell short near the upper trendline once a rejection is confirmed by price action and, ideally, a volume pickup. Place a stop just above the upper line or above the most recent swing high. The first target is the lower trendline; more conservative traders cover part of the position well before price reaches it.
2. Trading the Breakdown
A decisive close below the lower trendline, accompanied by a clear increase in volume, can mark an acceleration of the downtrend rather than just another test of support. Some traders treat this as a breakdown trade, using the channel's width as a rough, minimum measured-move target below the breakdown point — though this projection is far less rigorously supported than the height-based targets used for flags or triangles, so treat it as a loose guide rather than a firm expectation.
3. Reading a Breakout
A decisive close above the upper trendline, particularly on increased volume, is the standard warning that the downtrend may be over. This is the highest-conviction signal the pattern produces, since it represents a genuine failure of the line that had been holding the entire structure together — treat it as a reason to cover shorts rather than to sell into the rally.
Volume Confirmation
Volume should expand noticeably on rejections from the upper trendline — that expansion is what distinguishes a genuine resistance test from one that's likely to fail. Volume during rallies within the channel should stay relatively light, and volume approaching the lower line is typically moderate rather than heavy. Either a breakdown below support or a breakout above resistance carries more weight when it comes with volume clearly above the channel's recent average; a break on unremarkable volume is easier to dismiss as noise.
Combining with Other Indicators
Declining moving averages that track roughly parallel to the channel's upper line add confirmation, and a channel that stays below its 50-day average is generally viewed as more firmly bearish than one drifting above it. RSI that stays weak (broadly below the midline) throughout the channel, without strong pushes into overbought territory on rallies, supports the bearish read. These are supporting signals, not requirements.
Common Mistakes
Buying inside an intact channel. Taking counter-trend long positions within a healthy descending channel fights the dominant trend and is a low-probability trade.
Ignoring volume on resistance tests. A rejection at the upper line without any pickup in volume is a weaker signal than it looks.
Treating the lower line as a hard floor. Price can and often does push through the lower trendline as the downtrend accelerates; don't automatically fade every approach to support.
Overweighting the breakdown target. The channel-width projection below a breakdown is a rough guide, not a precise objective — don't treat it as a guarantee.
Missing the real warning sign. The upper trendline, not the lower one, is what actually defines the trend. A break above it deserves far more attention than a stall near support.
Descending Channel vs. Falling Wedge
Both patterns feature two downward-sloping lines, but a descending channel's lines stay parallel while a falling wedge's lines converge. The channel is a continuation structure that can persist for a long time and offers repeated trading opportunities; the wedge is a reversal pattern where narrowing range and fading volume typically precede an upside break.
Descending Channel vs. Descending Triangle
A descending channel has both lines sloping downward; a descending triangle has flat support with only the resistance line falling, so the two lines converge rather than running parallel. The triangle typically builds toward a single decisive breakdown, while the channel offers multiple resistance and support touches along the way.
FAQs
What's the best entry point for channel trading?
Selling short near the upper trendline, after a confirmed rejection with some volume support, is the standard entry. A stop just above that line, or above the most recent swing high, defines the risk on the trade.
How do you set a price target for a channel breakdown?
The channel's width, projected below the breakdown point, is the common rough target — but treat it as a loose estimate rather than a precise, well-supported number the way you would with a flag or triangle measured move.
What actually signals the channel has failed?
A decisive close above the upper trendline, ideally on increased volume, is the primary warning that the downtrend may be reversing. This matters more than any single stall near the lower line.
What volume characteristics confirm the channel is healthy?
Volume should pick up on rejections from resistance and stay comparatively light during rallies within the channel. A breakdown or breakout carries more weight when confirmed by a clear increase in volume.
Should you ever trade the long side inside a descending channel?
Generally no. Short-term covering near support can work for very active traders, but holding a long position against an intact downtrend is fighting the dominant trend.
Conclusion
A descending price channel captures an orderly downtrend between two parallel, falling trendlines, giving traders repeated opportunities to sell near resistance with a defined stop. The pattern remains bearish as long as the upper line holds; a decisive break of that line — not a stall near the lower one — is the signal that actually matters for judging whether the trend is over.