Flag Pattern (Bear)
Updated Aug 26, 2026
- Signal
- Bearish
- Reliability
- High
- Volume Confirmation
- Required
- Market Conditions
- Works best in trending and momentum markets
On this page
A bear flag is a short-term continuation pattern: a sharp, high-volume decline (the "flagpole") followed by a brief pause where price drifts sideways or slightly higher in a tight, parallel channel (the "flag") before resuming the original downtrend. It represents a healthy pause in a strong decline rather than a change in trend. This guide covers how to identify a genuine bear flag, how volume should behave through each phase, and how to set a realistic target.
What Is a Bear Flag?
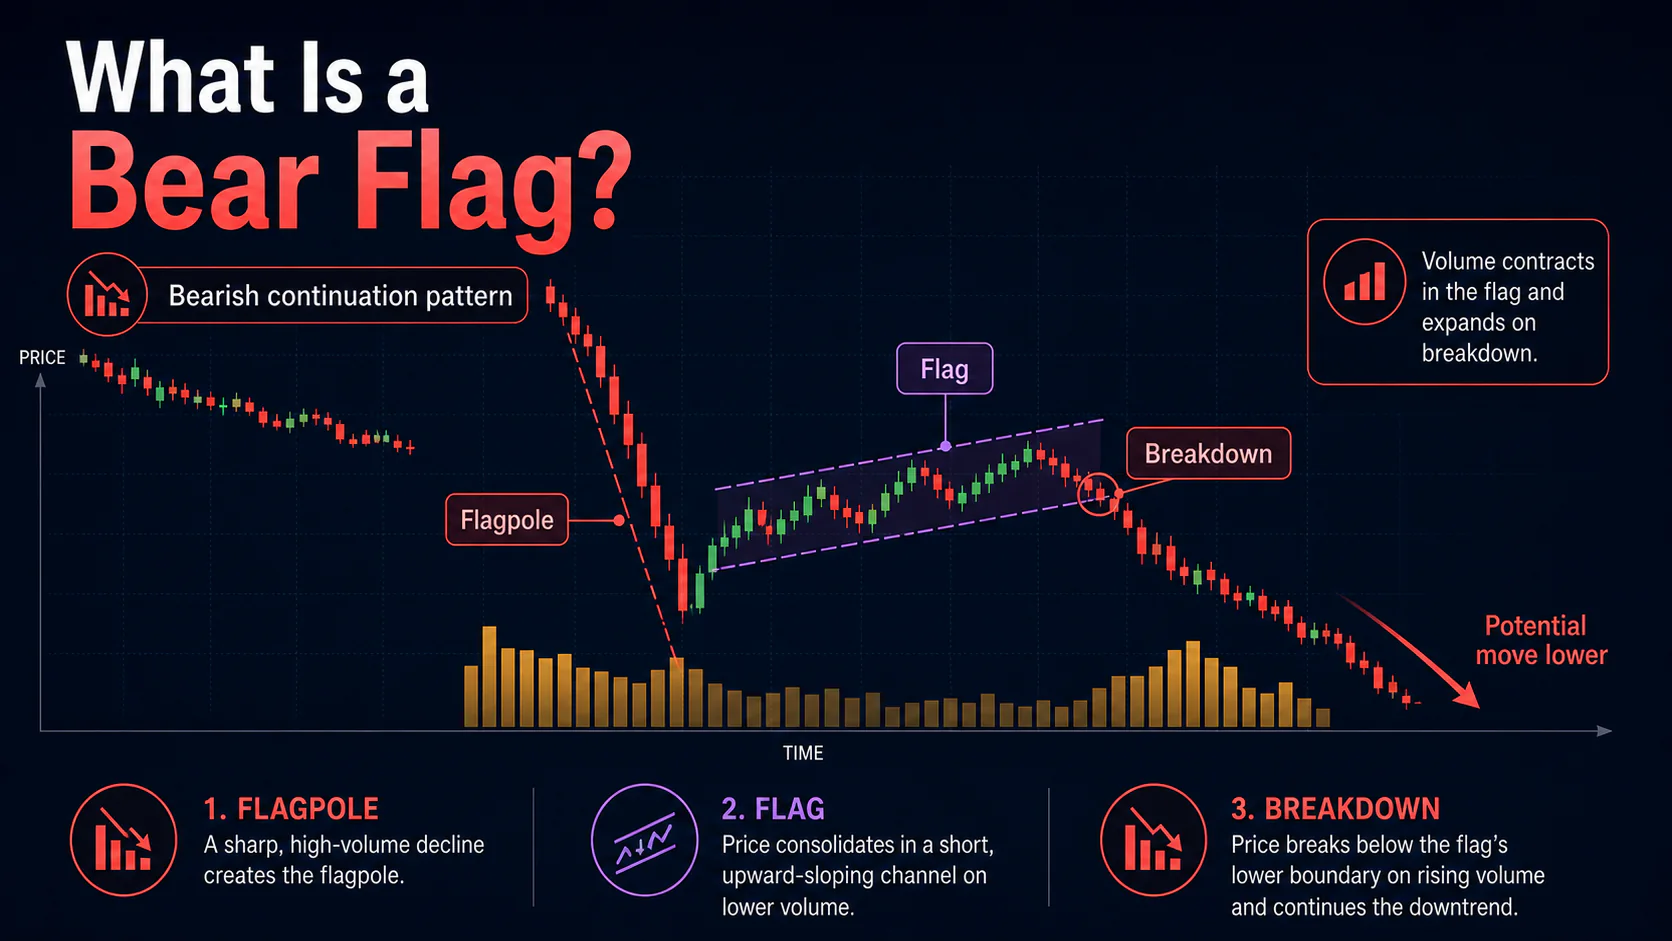
The pattern has two distinct phases. The flagpole is a steep, fast decline on strong volume, usually tied to a catalyst or a sudden surge of selling pressure. The flag is a tight, controlled consolidation immediately afterward — typically drifting slightly upward or sideways in a narrow parallel channel — on noticeably lighter volume than the flagpole. When price breaks below the flag's lower boundary with a renewed pickup in volume, the pattern is considered complete and the prior downtrend is expected to resume.
Flags are short-lived by nature. On a daily chart, the flag portion typically lasts from a few days to a few weeks — meaningfully shorter than the flagpole that preceded it. The longer a flag drags on without breaking down, the more the pause starts to look like accumulation rather than a pause, and the higher the odds the pattern fails.
Anatomy of the Pattern
Flagpole
- A steep, nearly vertical decline on noticeably elevated volume
- Represents the initial burst of selling pressure that the flag will consolidate
Flag
- A brief consolidation contained by two roughly parallel trendlines
- Drifts sideways or slightly upward — a flag that drifts downward against the trend is a weaker, less classic version of the pattern
- Volume should contract noticeably compared to the flagpole
Breakdown Point
- A decisive close below the flag's lower trendline, ideally with a pickup in volume
- Triggers the measured-move target described under Trading Strategies below
Pattern Psychology
The flagpole reflects a sudden surge of selling pressure — often tied to negative news — that draws in momentum sellers and long liquidation. Once that initial move runs its course, early sellers begin covering or taking partial profits, causing the mild bounce or sideways drift that forms the flag. Because volume drops off sharply during this phase, the light buying doesn't do lasting damage to the decline; it's better described as digestion than accumulation. When volume picks back up and price breaks the flag's lower boundary, renewed selling — along with stops triggered on any remaining long positions — tends to push price into the next leg down.
Variations Worth Knowing
Rectangular flag: a flat, sideways consolidation rather than an upward drift. This is the most common and easiest to identify version.
Pennant: essentially a flag with converging (rather than parallel) trendlines, forming a small symmetrical triangle after the flagpole. It carries the same continuation implications and is traded the same way.
High, tight flag (bearish): an unusually sharp flagpole decline followed by a very shallow, narrow consolidation. These are less common but tend to be higher-conviction setups precisely because the bounce is so shallow relative to the preceding decline.
Trading Strategies
1. Breakdown Entry
Wait for a decisive close below the flag's lower trendline with volume clearly above the recent average, then enter short on the break or on a modest pullback. Place a stop above the flag's high, or above the flagpole's midpoint for a wider stop.
2. Flag Resistance Entry
More aggressive traders sell near the upper boundary of the flag while volume is still light, anticipating the breakdown. This improves the entry price and allows a tighter stop just above the flag high, but the pattern isn't confirmed until the breakdown actually occurs.
3. Retest Entry
After the initial breakdown, price sometimes pulls back to retest the broken flag support as new resistance. A failed retest offers a better-confirmed, lower-risk entry than chasing the initial breakdown.
Setting Targets
The standard target — sometimes described as "flags fly at half-mast" — is the height of the flagpole projected downward from the breakdown point. Treat this as the primary, minimum objective; prior support levels or Fibonacci extensions of the flagpole can serve as secondary targets if momentum carries price further.
Volume Confirmation
Volume should be clearly elevated during the flagpole, reflecting genuine selling pressure rather than a low-volume drift. It should then contract meaningfully during the flag itself — the deeper and more consistent the contraction, the more constructive the pattern for continuation. The breakdown should come with a renewed pickup in volume, ideally exceeding what was seen during the flagpole; a breakdown on unremarkable volume is far less trustworthy.
Combining with Other Indicators
RSI holding below the midline throughout the flag, rather than surging into overbought territory, supports the continuation read, and a fresh push lower in RSI on the breakdown adds confirmation. A MACD that stays below its zero line through the consolidation, with a bearish crossover near the breakdown, offers similar support. Neither is required, but agreement across price, volume, and momentum lowers the odds of a false signal.
Failed Patterns
A bear flag fails when price breaks up through the flag's upper boundary on increased volume, or when the consolidation drags on well beyond a normal flag duration without resolving lower — both are signs the pause has turned into genuine accumulation. Failed flags can lead to a meaningful reversal of the prior decline, so it's worth exiting or reassessing quickly rather than assuming the breakdown is simply late.
Common Mistakes
Misreading a slow drift as a flagpole. The flagpole needs to be a genuinely sharp, high-volume decline — a gradual grind lower doesn't set up a valid flag.
Ignoring the volume contraction. A "flag" that consolidates on steady or rising volume is less trustworthy than one that shows a clear volume drop-off.
Entering too early. Shorting mid-consolidation without confirmation risks getting caught if the pattern fails.
Letting the flag run too long. The longer a flag extends past a typical multi-day-to-multi-week window, the more the failure risk rises.
Fighting the broader market. A bear flag against a strong or rising broader market is less reliable than one that forms alongside broad weakness.
Bear Flag vs. Other Patterns
Bear Flag vs. Descending Triangle: a flag requires a preceding flagpole and is a short-term pause measured in days to weeks; a descending triangle can form independently of any prior sharp move and typically takes longer to build.
Bear Flag vs. Head and Shoulders: a flag is a brief, tight consolidation within an active trend; a head and shoulders is a longer topping formation that can take months to complete.
Bear Flag vs. a Simple Pullback: a flag has clearly defined parallel boundaries, a distinct volume signature, and a measurable target; an ordinary bounce lacks that structure and is harder to trade with precision.
FAQs
How reliable is the bear flag pattern?
It's considered one of the more dependable continuation patterns because its structure — a sharp flagpole, contracting volume, tight boundaries — is fairly objective to verify. Reliability improves further when the flag forms in a strong downtrend or a lagging stock and stays short in duration; it degrades the longer the consolidation drags on.
What's the difference between a bear flag and a bull flag?
A bear flag follows a sharp downward flagpole and consolidates with a slight upward or sideways drift before breaking lower. A bull flag is the mirror image: a sharp upward flagpole followed by a slight downward or sideways drift before breaking higher.
How do you calculate a bear flag's price target?
Measure the flagpole's height from its high to its low, then subtract that distance from the breakdown point below the flag. This gives the standard "half-mast" measured-move target.
Can a bear flag fail?
Yes — if price breaks up through the flag's resistance instead of breaking down, or the consolidation runs on too long without resolving, the pattern has failed and can precede a real reversal of the prior decline.
What volume pattern confirms a bear flag?
High volume on the flagpole, a clear contraction during the flag, and a renewed pickup in volume on the breakdown — ideally exceeding the flagpole's volume.
How long should a bear flag take to form?
Flags are meant to be brief — on a daily chart, expect the consolidation to last from several days up to a few weeks, generally shorter than the flagpole that preceded it. A flag that drags on much longer than that starts to lose its edge.
Conclusion
A bear flag is a short pause within a strong downtrend: a sharp decline on heavy volume, followed by a brief, light-volume consolidation before the trend resumes. Its value to traders comes from its clear structure — a defined flagpole for measuring targets, tight boundaries for placing stops, and a specific volume signature for confirming the breakdown. Because flags are meant to be short-lived, watch the clock as closely as the price: a flag that overstays its welcome is more likely to fail than to fly.