Head and Shoulders
Updated Aug 26, 2026
- Display Type
- Chart Pattern
- Complexity
- Intermediate
- Best For
- Trend Reversal Detection, Major Turning Points, High-Probability Entries, Risk-Reward Optimization
On this page
Head and Shoulders is a bearish reversal pattern that typically forms at the end of an uptrend. It consists of three successive peaks — a left shoulder, a higher head, and a right shoulder roughly equal in height to the left shoulder — connected by a support line called the neckline. A decisive close below the neckline confirms the pattern and signals a likely shift from an uptrend to a downtrend.
What Is a Head and Shoulders Pattern?
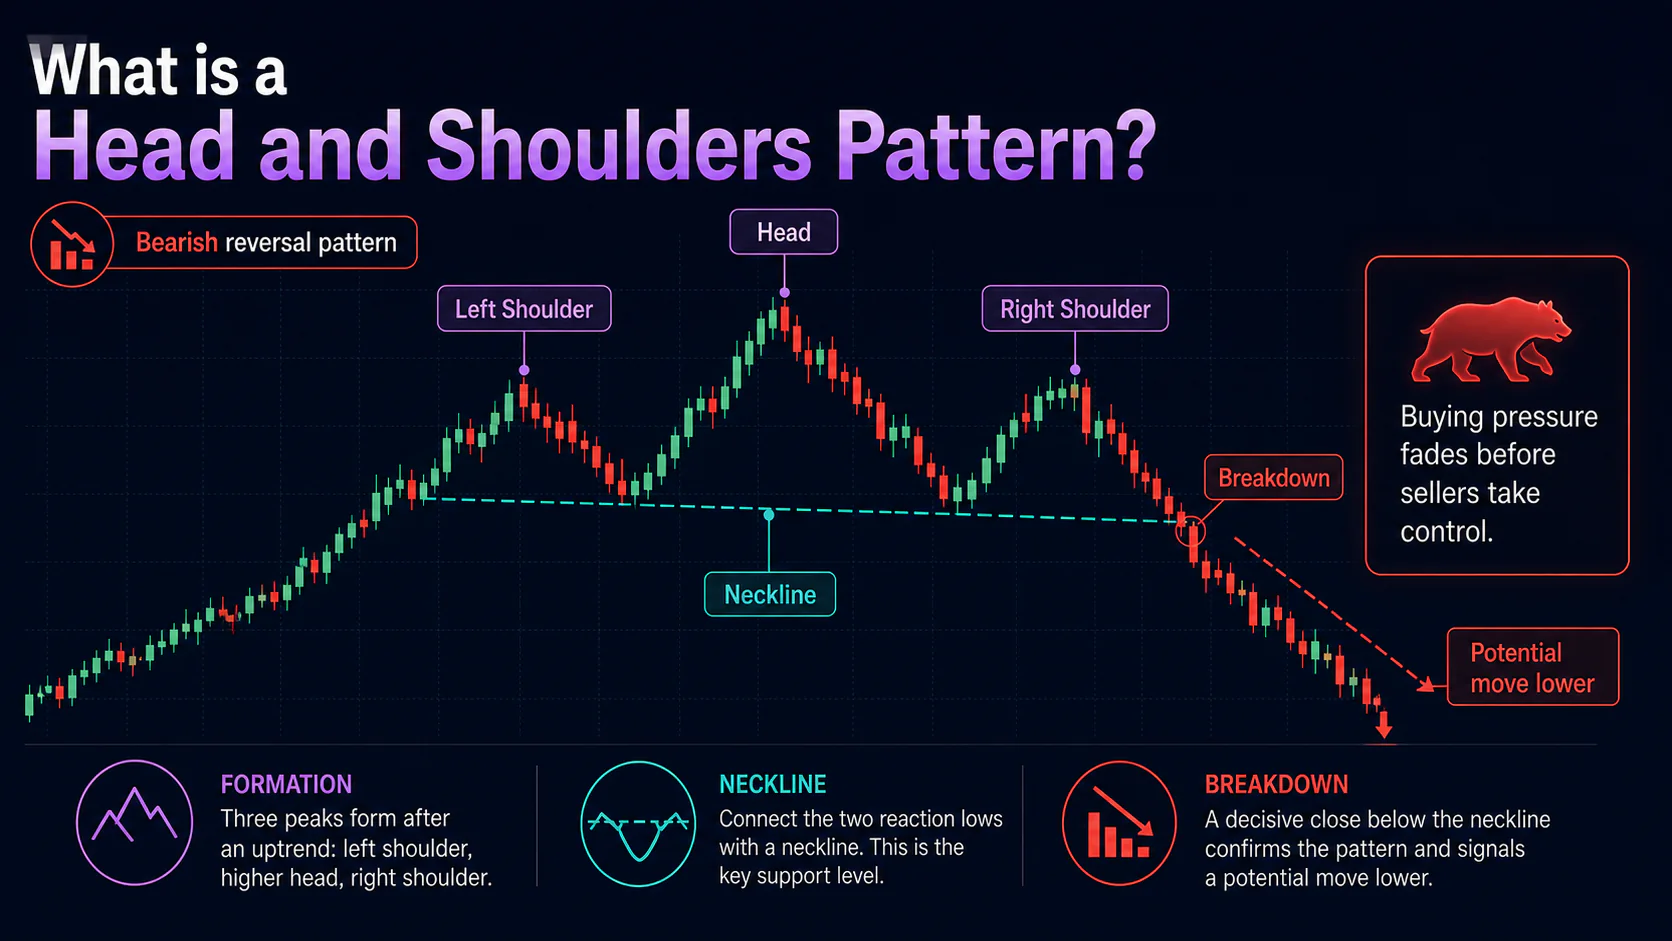
The three peaks capture a gradual shift in market psychology. The left shoulder forms during the final push of the existing uptrend, often on strong volume, as buyers make one more run at new highs. The head forms above it, but typically on lighter volume — a warning sign that fewer buyers are willing to chase price higher. The right shoulder is a weaker attempt that fails to reach the head, usually on the lightest volume of the three peaks. When price finally closes below the neckline, sellers have taken control, and the move can accelerate as stop-loss orders and technical selling join in.
Key Uses
- Trend Reversal Identification: Signals the end of an uptrend and the start of a downtrend
- Major Turning Points: Helps identify significant market tops
- Defined Entries and Stops: The neckline break and pattern highs give clear entry and risk levels
- Price Target Calculation: The head-to-neckline distance provides a measured-move target
Anatomy of the Pattern
Left Shoulder: The first peak, formed during the final leg of the uptrend, usually on solid volume as the last wave of buying enthusiasm plays out.
Head: The highest peak, exceeding both shoulders. It often forms on volume that is lower than the left shoulder — a bearish divergence between price and volume that hints at fading demand.
Right Shoulder: The third peak, similar in height to the left shoulder (commonly within a few percent), usually on the lightest volume of the three peaks. Failure to exceed the head confirms the resistance is holding.
Neckline: The support line connecting the two reaction lows between the peaks. It can be horizontal, ascending, or descending, and acts as the trigger level — a close below it confirms the pattern.
Volume Confirmation
Volume typically diminishes across the three peaks — highest on the left shoulder, lower on the head, and lowest on the right shoulder — creating a bearish divergence as price makes a higher high while volume makes a lower high. The neckline break should occur on volume that is noticeably above the recent average; a breakdown on light volume is less trustworthy and more prone to failure. Any pullback that retests the broken neckline should ideally happen on lighter volume than the breakdown itself.
Pattern Variations
Classic Head and Shoulders: A clean three-peak formation with a head that clearly exceeds both shoulders and a roughly horizontal neckline. These tend to be easier to trade because the levels are unambiguous.
Complex Head and Shoulders: Some formations include multiple smaller peaks near the head or shoulders (a double head, or extra minor shoulders). The core logic is unchanged — the middle structure still marks the highest point — but the pattern takes longer to complete and can produce more false breakout attempts along the way.
Slanted Necklines: An ascending neckline is generally considered a somewhat less bearish variant since it shows the lows were still rising into the top; a descending neckline shows more clearly deteriorating demand.
The mirror image of this pattern at market bottoms is the Inverse Head and Shoulders, a bullish reversal pattern with the same three-part structure turned upside down.
Trading Strategies
Breakout Entry: Wait for a decisive close below the neckline, ideally with volume above average, then enter short on the break or on a retest of the neckline from below. Place a stop above the right shoulder (or above the neckline for a tighter, more aggressive stop). The minimum target is the vertical distance from the head to the neckline, projected downward from the breakout point; secondary targets are prior support levels.
Early Entry: More experienced traders sometimes enter short as the right shoulder forms and shows clear volume divergence and a failure to approach the head. This can improve the risk-reward ratio but the pattern is not yet confirmed, so the failure rate is higher and position sizing should be more conservative.
Retest Entry: After the initial neckline break, price sometimes pulls back to test the broken neckline as new resistance. Entering short on a failed retest offers a better entry price and a tight, well-defined stop just above the neckline, at the cost of occasionally missing the move if no retest occurs.
Combining With Other Analysis
Confluence with other tools can strengthen the case for a Head and Shoulders setup. A neckline that lines up with a prior support level or a major moving average (the 200-day is a common reference) carries more weight than one sitting in open space. Momentum indicators such as the RSI or MACD often show bearish divergence across the three peaks — making lower highs while price makes a higher high — which can lead the price confirmation. Fibonacci retracements can also be useful for gauging where shoulders are likely to form relative to the prior advance.
Failed Pattern Recognition
Not every Head and Shoulders setup completes. Warning signs of failure include strong volume on a neckline test that doesn't actually break, price rallying back above the right shoulder, or a new high above the head on strong volume. When the pattern fails, it often does so decisively — the failed breakdown can trigger short covering that fuels a sharp rally in the original trend direction. Traders who recognize a clear failure sometimes flip to the long side, targeting the prior highs or a measured move upward from the failure point.
Common Mistakes
Premature pattern recognition: Calling the pattern before the right shoulder and neckline are actually in place. Wait for all three peaks and a defined neckline before acting.
Ignoring volume: Trading a neckline break without confirming that volume is behind it. A breakdown on thin volume is far more likely to fail.
Poor stop placement: Setting stops too tight (inside recent noise) or not at all. Stops belong above a clearly defined pattern high.
Ignoring market context: Trading a pattern that runs counter to the dominant trend or broader market conditions without extra confirmation.
FAQs
How reliable is the Head and Shoulders pattern?
It is one of the more widely followed reversal patterns, and its reliability improves substantially with volume confirmation on the neckline break, a clean three-peak structure, and formation on daily or weekly charts rather than short intraday timeframes. No chart pattern works consistently on its own, so it's best combined with volume and broader trend context rather than traded in isolation.
What's the difference between Head and Shoulders and Inverse Head and Shoulders?
Head and Shoulders is a bearish reversal pattern that forms at market tops; Inverse Head and Shoulders is the bullish mirror image that forms at market bottoms. The volume and psychology are reversed accordingly.
How do you calculate Head and Shoulders price targets?
Measure the vertical distance from the head to the neckline, then project that same distance downward from the point where price breaks the neckline. That gives the minimum measured-move target; prior support levels can serve as secondary targets.
Can Head and Shoulders patterns fail?
Yes. A pattern fails when the neckline holds and price rallies back above the right shoulder or to new highs. Failed patterns can lead to sharp moves back in the original uptrend direction as short positions are covered.
What volume pattern confirms a Head and Shoulders?
Volume should generally decrease from the left shoulder through the right shoulder, with the neckline break occurring on volume that is clearly above the recent average.
How long should the pattern take to form?
There's no fixed duration — the pattern appears on timeframes from intraday charts to multi-year charts. As a general rule, patterns on daily and weekly charts are considered more reliable than those on short intraday timeframes, which tend to be noisier and more prone to false breaks.
Conclusion
Head and Shoulders remains one of the most widely recognized reversal patterns because it gives traders a clear structure: three peaks, a neckline, a breakdown trigger, and a straightforward measured-move target. Its value comes from combining the pattern with proper volume confirmation and an awareness of the broader trend — used in isolation, no chart pattern is a guarantee, but Head and Shoulders offers a well-defined framework for spotting when an uptrend may be running out of buyers.