MACD (Moving Average Convergence Divergence)
Updated Aug 26, 2026
- Display Type
- Oscillator
- Complexity
- Beginner to Intermediate
- Best For
- Momentum Analysis, Trend Confirmation, Divergence Detection, Entry/Exit Signals
On this page
MACD (Moving Average Convergence Divergence) is a momentum oscillator that tracks the relationship between two exponential moving averages of price to reveal trend direction and momentum shifts. Developed by Gerald Appel in the 1970s, it combines a MACD line, a signal line, and a histogram into one indicator. This guide covers how MACD is calculated, how to read crossovers and divergence, practical strategies, and where the indicator tends to fail.
What Does MACD Measure?
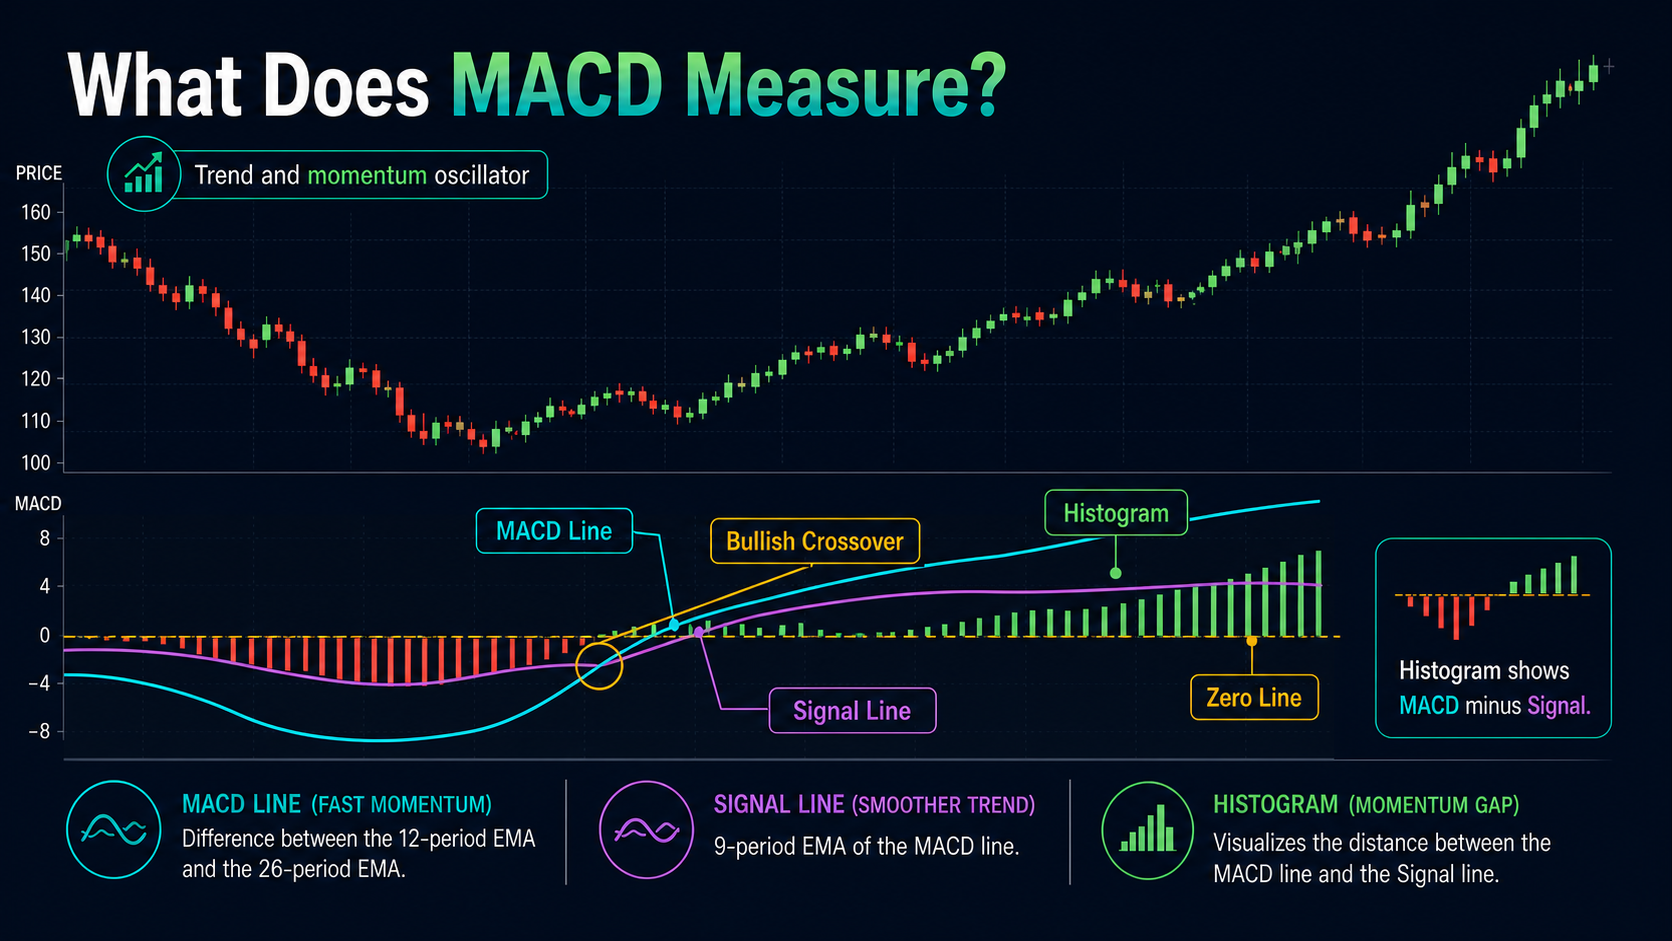
MACD tracks the convergence and divergence between a fast and a slow EMA of price, then smooths that difference with a signal line. Because it blends trend-following and momentum characteristics, it can confirm trend direction through the zero line and time entries within that trend through crossovers, using the same three components.
Key Uses
- Momentum analysis: measure the strength and speed of a price move
- Trend confirmation: validate trend direction via the zero line
- Divergence detection: flag potential reversals before price confirms them
- Entry/exit timing: generate signals through line crossovers
How MACD Is Calculated
- MACD Line = 12-period EMA - 26-period EMA
- Signal Line = 9-period EMA of the MACD Line
- Histogram = MACD Line - Signal Line
Default Parameters
- Fast EMA: 12 periods
- Slow EMA: 26 periods
- Signal Line: 9-period EMA of the MACD line
- Source: Close price
Reading the Three Components
- MACD line: positive values mean the fast EMA is above the slow EMA (upward momentum bias); negative values mean the opposite.
- Signal line: a smoothed version of the MACD line that acts as the trigger for crossover signals.
- Histogram: MACD minus signal, plotted as bars. Expanding bars mean momentum is accelerating; contracting bars mean it’s decelerating, often before the lines actually cross.
- Zero line: a MACD line crossing zero marks the fast EMA crossing the slow EMA — a signal of a broader trend change.
Signal Types
- Signal line crossover: MACD crossing above the signal line is bullish; crossing below is bearish. Crossovers on the same side of zero as their direction (e.g., a bullish cross above zero) are generally more reliable than crossovers near zero in a choppy market.
- Zero line crossover: MACD crossing above or below zero marks a bigger, less frequent trend-change signal.
- Divergence: price and MACD moving in opposite directions, often ahead of a reversal — wait for an actual signal-line crossover before acting on it.
MACD Settings by Trading Style
| Trading Style | Fast EMA | Slow EMA | Signal |
|---|---|---|---|
| Scalping | 5 | 13 | 5 |
| Day trading / swing trading | 12 (standard) | 26 | 9 |
| Position trading | 19 | 39 | 14 |
Trading Strategies
1. Signal Line Crossover
Buy when MACD crosses above the signal line; sell or short when it crosses below. Signals are generally stronger when they occur on the same side of the zero line as the crossover direction. Place stops beyond the recent swing high or low and target the previous resistance or support level.
2. Zero Line Crossover
Trade the MACD line crossing zero as a trend-change signal. This produces fewer, typically higher-conviction signals than the signal-line crossover, with a natural stop reference near the zero line itself.
3. Histogram Momentum
Use histogram expansion as confirmation that a move has momentum behind it, and histogram contraction as an early warning that momentum is fading — often before the MACD and signal lines actually cross.
4. Divergence
Bullish divergence: price makes a lower low while MACD makes a higher low. Bearish divergence: price makes a higher high while MACD makes a lower high. Wait for a confirming signal-line crossover before entering, and set tighter stops given the counter-trend nature of the trade.
5. Multiple Timeframe Confirmation
Check MACD on a higher timeframe for the overall momentum bias, then use the trading timeframe for the actual crossover entry — for example, a bullish daily MACD combined with a fresh bullish crossover on the 4-hour chart. Signals that align across timeframes are more selective but generally more reliable than a single-timeframe reading.
Combining MACD with Other Indicators
- RSI: check that a MACD crossover isn’t already firing into an overbought or oversold RSI reading before acting on it.
- Moving averages: trade MACD signals only in the direction of the 50/200 EMA trend.
- Support/resistance: a MACD crossover near a key level, especially alongside a breakout, is a stronger setup than either signal alone.
- ADX: a rising ADX above 25 alongside a MACD crossover in the same direction adds confidence that a real trend supports the signal.
Limitations and Common Mistakes
- Lag: because MACD is built from EMAs of historical prices, it confirms moves after they start rather than predicting them — that lag is the trade-off for the noise filtering it provides.
- Whipsaws in range-bound markets: in a sideways market the MACD and signal line cross frequently, generating a run of false signals. Use MACD primarily for trending conditions, or filter it with ADX or a moving average.
- Trading every crossover: not every cross is worth acting on — check its position relative to zero and the broader trend first.
- Wrong settings for the timeframe: the default 12/26/9 is built for daily charts; scalping or position-trading timeframes generally call for different EMA lengths.
- Ignoring the histogram: waiting for the MACD and signal lines to physically cross means missing the early warning the histogram often gives as it contracts before that cross happens.
FAQs
What are the best MACD settings?
The standard settings (12, 26, 9) work well for most timeframes. Faster settings such as (8, 21, 5) produce quicker but noisier signals; slower settings such as (19, 39, 14) are smoother but lag more. Backtest on your specific market before changing the defaults.
How do you read the MACD histogram?
The histogram shows the gap between the MACD line and the signal line. An expanding histogram means momentum is accelerating; a contracting histogram means it’s decelerating. The histogram crossing zero often precedes the MACD and signal lines actually crossing.
What’s the difference between MACD and RSI?
MACD is unbounded and centers on trend momentum, while RSI is bounded between 0 and 100 and centers on overbought/oversold conditions. MACD is generally better at catching trend changes; RSI is generally better at flagging reversal zones. The two are often used together.
How do you spot MACD divergence?
Compare price highs and lows against MACD highs and lows. Bullish divergence: price makes a lower low while MACD makes a higher low. Bearish divergence: price makes a higher high while MACD makes a lower high. Divergence often precedes a reversal but should be confirmed with a crossover before trading it.
Why does MACD lag price?
MACD is built from exponential moving averages, which are themselves derived from historical prices. That built-in lag is what filters out noise and produces more reliable signals than a purely real-time oscillator, at the cost of earlier entries.
Can MACD predict a market reversal?
Not with certainty. Divergence between price and MACD provides an early warning, but it can keep building for several swings before price actually turns. Combine divergence with support/resistance, volume, or price action rather than treating it as a standalone reversal signal.
Conclusion
MACD works well because it combines trend and momentum analysis in one indicator: the zero line for trend bias, the signal-line crossover for timing, and the histogram for reading whether momentum is building or fading. It performs best in trending markets and struggles in choppy, sideways ones, so pair it with a trend filter and confirm signals with price action rather than trading every crossover in isolation.