Stochastic Oscillator
Updated Aug 26, 2026
- Display Type
- Oscillator
- Complexity
- Beginner to Intermediate
- Best For
- Overbought/Oversold Analysis, Cycle Analysis, Momentum Analysis, Entry/Exit Timing
On this page
Stochastic is a momentum oscillator that compares a security’s closing price to its trading range over a set lookback period to flag overbought and oversold conditions. Developed by George Lane, it uses two lines — %K and %D — that move between 0 and 100 based on where price closes relative to its recent high-low range. This guide covers the formula, fast versus slow variants, common signals, and where the indicator tends to mislead.
What Is Stochastic?
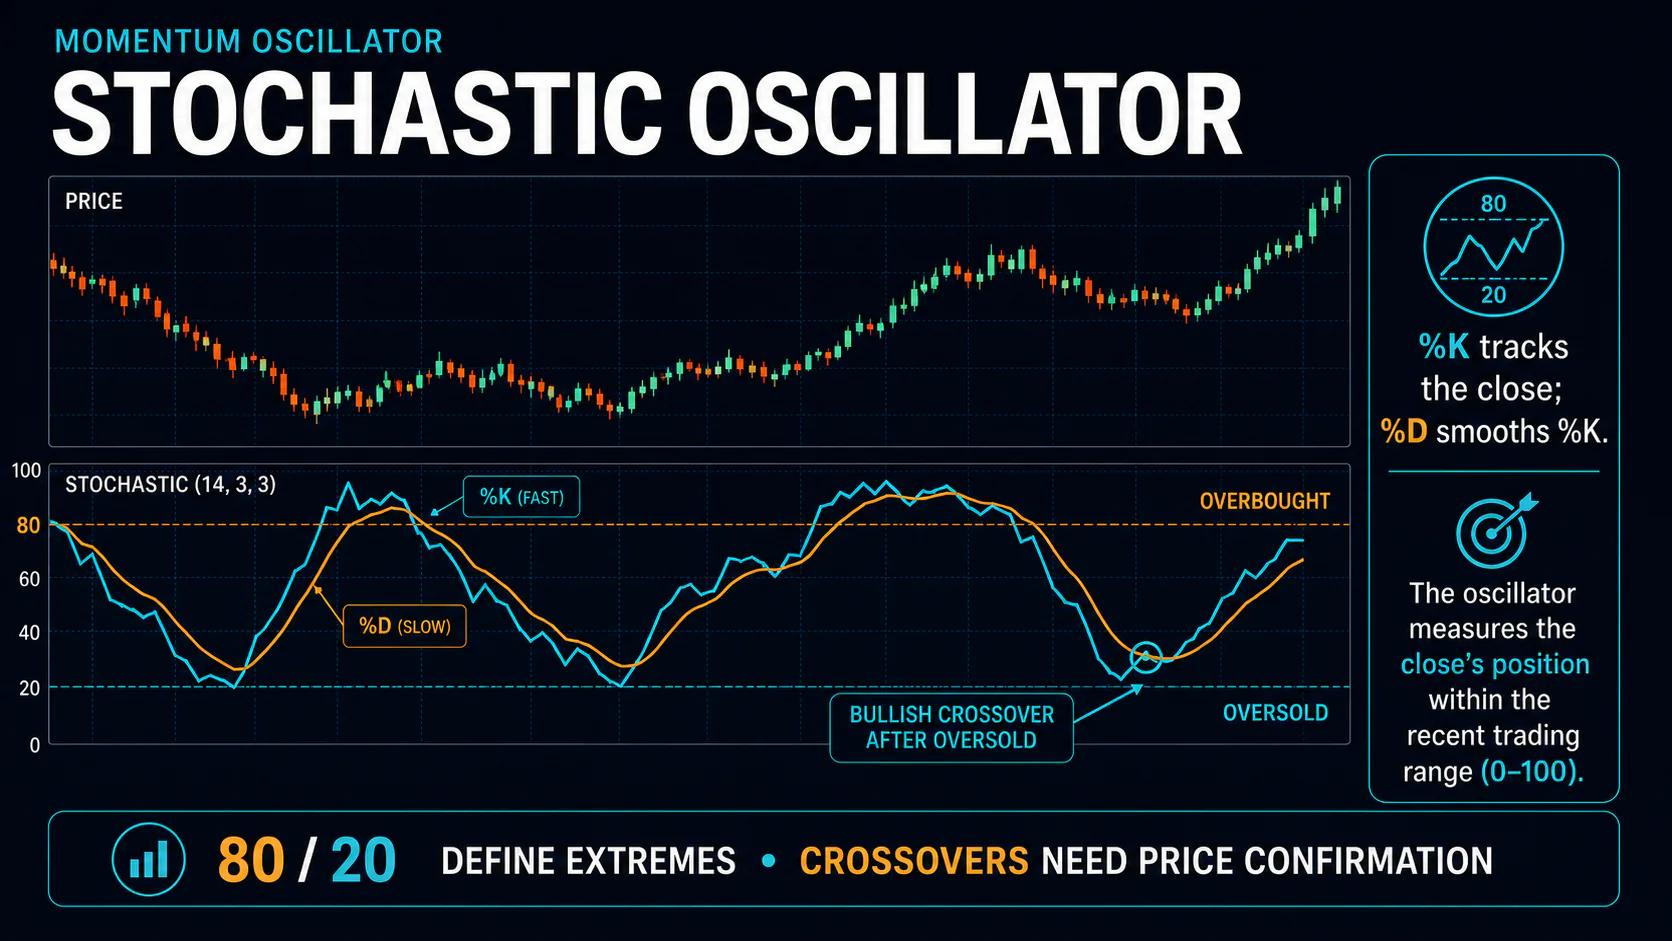
Stochastic is built on the premise that closing prices tend to finish near the high of the range in an uptrend and near the low in a downtrend. When price consistently closes near the top of its recent range, Stochastic approaches 100; when it closes near the bottom, Stochastic approaches 0. Unlike RSI, which uses a ratio of average gains to average losses, Stochastic measures price position within a range, making it more sensitive to short-term swings — and more prone to false signals in a strongly trending market.
Key Uses
- Overbought/oversold identification: spot momentum extremes
- Cycle analysis: track recurring swings in range-bound markets
- Divergence detection: flag potential reversals before price confirms them
- Entry/exit timing: generate signals through %K/%D crossovers
How Stochastic Is Calculated
%K = [(Current Close - Lowest Low) ÷ (Highest High - Lowest Low)] × 100, using the highest high and lowest low over the lookback period (14 by default).
%D is a 3-period simple moving average of %K, plotted alongside %K as a signal line.
Default Parameters
- %K Period: 14
- %K Smoothing: 3 (for the standard “slow” version)
- %D Period: 3
- Overbought: 80
- Oversold: 20
Fast vs. Slow Stochastic
Fast Stochastic plots the raw %K with no smoothing, making it very sensitive but prone to whipsaws. Slow Stochastic — the version most platforms show by default — smooths %K with a 3-period SMA before plotting it, then applies another 3-period SMA to get %D, trading some responsiveness for fewer false signals. Full Stochastic lets both smoothing periods be set independently.
Reading Stochastic Signals
- Overbought: both lines above 80
- Oversold: both lines below 20
- Bullish crossover: %K crosses above %D, more significant when it happens in the oversold zone
- Bearish crossover: %K crosses below %D, more significant when it happens in the overbought zone
- Divergence: price and Stochastic move in opposite directions
Regular vs. Hidden Divergence
Regular divergence warns of a reversal: price makes a lower low while Stochastic makes a higher low (bullish), or price makes a higher high while Stochastic makes a lower high (bearish). Hidden divergence signals trend continuation instead — price makes a higher low while Stochastic makes a lower low (bullish continuation), or the reverse for bearish continuation.
Stochastic Settings by Trading Style
| Trading Style | %K Period | %K Smooth | %D Period | Overbought | Oversold |
|---|---|---|---|---|---|
| Scalping | 5 | 1 | 3 | 85 | 15 |
| Day trading / swing trading | 14 (standard) | 3 | 3 | 80 | 20 |
| Position trading | 21 | 5 | 5 | 75 | 25 |
Trading Strategies
1. Overbought/Oversold Reversal
Long: both %K and %D below 20, then %K crosses above %D. Short: both above 80, then %K crosses below %D. Stop beyond the recent swing high/low; target the opposite extreme zone or a key price level.
2. Crossover Strategy
Trade %K/%D crossovers generally, but weight crossovers from the extreme zones — oversold for bullish, overbought for bearish — more heavily than crossovers in the middle of the range.
3. Divergence Trading
Identify divergence between price and Stochastic at swing highs/lows, then enter on a crossover signal within the relevant extreme zone rather than on the divergence alone.
4. Failure Swing (Stochastic “Pop”)
Occasionally Stochastic reaches an extreme zone but price fails to reverse as expected — instead, momentum accelerates further in the same direction. Rather than fading that failed extreme, some traders treat it as a continuation signal: a decisive break above 20 or below 80 that doesn’t hold, followed by a strong push back to the extreme, suggests unusually strong underlying momentum rather than an imminent reversal.
5. Multiple Timeframe Confirmation
Use a higher timeframe to gauge where the broader cycle stands — approaching an overbought or oversold extreme — and a lower timeframe for the actual crossover entry. A daily Stochastic nearing oversold combined with an hourly bullish crossover carries more weight than either reading taken alone, at the cost of fewer qualifying setups.
Combining Stochastic with Other Indicators
- RSI: Stochastic reacts faster to price swings; RSI is smoother. Signals that align on both indicators carry more weight, and Stochastic tends to lead in range-bound markets while RSI holds up better in trends.
- Moving averages: use a longer-term MA to define trend direction, and take Stochastic signals only in that direction.
- MACD: use Stochastic for extreme-zone timing and MACD to confirm the underlying momentum direction.
- Bollinger Bands: a price touch at a band alongside a matching Stochastic extreme is a stronger reversal setup than either signal alone.
Limitations and Common Mistakes
- Extended extremes in trends: Stochastic can stay pinned above 80 or below 20 for a long stretch in a strong trend — treating every extreme reading as an automatic reversal is a common mistake.
- High sensitivity means more noise: its range-based calculation reacts quickly, which also produces more false signals than smoother oscillators like RSI, especially on short timeframes.
- Ignoring the underlying trend: Stochastic performs best in cyclical, range-bound conditions; filter signals with a trend indicator before trading against a clear trend.
- Over-tweaking settings: constantly adjusting %K/%D periods to fit recent price action tends to hurt results more than it helps — the standard 14, 3, 3 is well tested for a reason.
FAQs
How is Stochastic different from RSI?
Stochastic measures where price sits within its recent high-low range; RSI measures the ratio of average gains to average losses. Stochastic is generally faster and more sensitive, which helps with timing but generates more false signals; RSI is smoother and holds up better in trends.
What are the best Stochastic settings?
The standard 14, 3, 3 settings work well for most applications. Faster markets sometimes use 9, 3, 3 or 5, 3, 3 for quicker signals; slower, smoother signals can use 21, 5, 5.
How do you trade Stochastic divergence?
Identify when price and Stochastic move in opposite directions, then wait for a crossover signal in the relevant extreme zone before entering. Confirm with support/resistance or volume rather than trading the divergence alone.
Can Stochastic stay overbought or oversold for a long time?
Yes, especially in strong trending markets, where it can remain above 80 or below 20 for an extended period. This is why trend context matters when interpreting Stochastic signals.
What’s the difference between Fast and Slow Stochastic?
Fast Stochastic uses the raw %K calculation and is more sensitive but noisier. Slow Stochastic smooths %K before plotting it, producing more reliable signals with less whipsaw — most traders default to the slow version.
What is a Stochastic failure swing?
It’s when Stochastic reaches an extreme zone but price doesn’t reverse as the reading would suggest, instead continuing in the same direction with renewed strength. Rather than a reversal cue, this pattern often signals unusually strong momentum and can be read as a continuation signal.
When should you avoid Stochastic signals?
Be cautious trading Stochastic extremes in strongly trending markets without a trend filter, around major news events, and in very low-volume conditions where readings can whipsaw unpredictably.
Conclusion
Stochastic’s sensitivity to short-term price swings makes it a useful timing tool, particularly in ranging and cyclical markets where its quick reaction to price is an advantage rather than a liability. In strongly trending markets, that same sensitivity produces more false signals, so pair it with a trend filter and treat extreme readings as one input among several rather than a standalone trigger.