ADX (Average Directional Index)
Updated Aug 26, 2026
- Display Type
- Oscillator
- Complexity
- Beginner to Intermediate
- Best For
- Trend Strength Analysis, Trend Confirmation, Market Filtering
On this page
The Average Directional Index (ADX) measures how strong a trend is, on a scale of 0 to 100, without indicating which direction the trend is moving. Developed by J. Welles Wilder Jr. in 1978, it’s built from the same directional-movement calculations that produce the +DI and -DI lines, which do show direction. This guide covers the formula, how to read ADX alongside +DI/-DI, practical strategies, and the most common misreading of the indicator.
What Does ADX Measure?
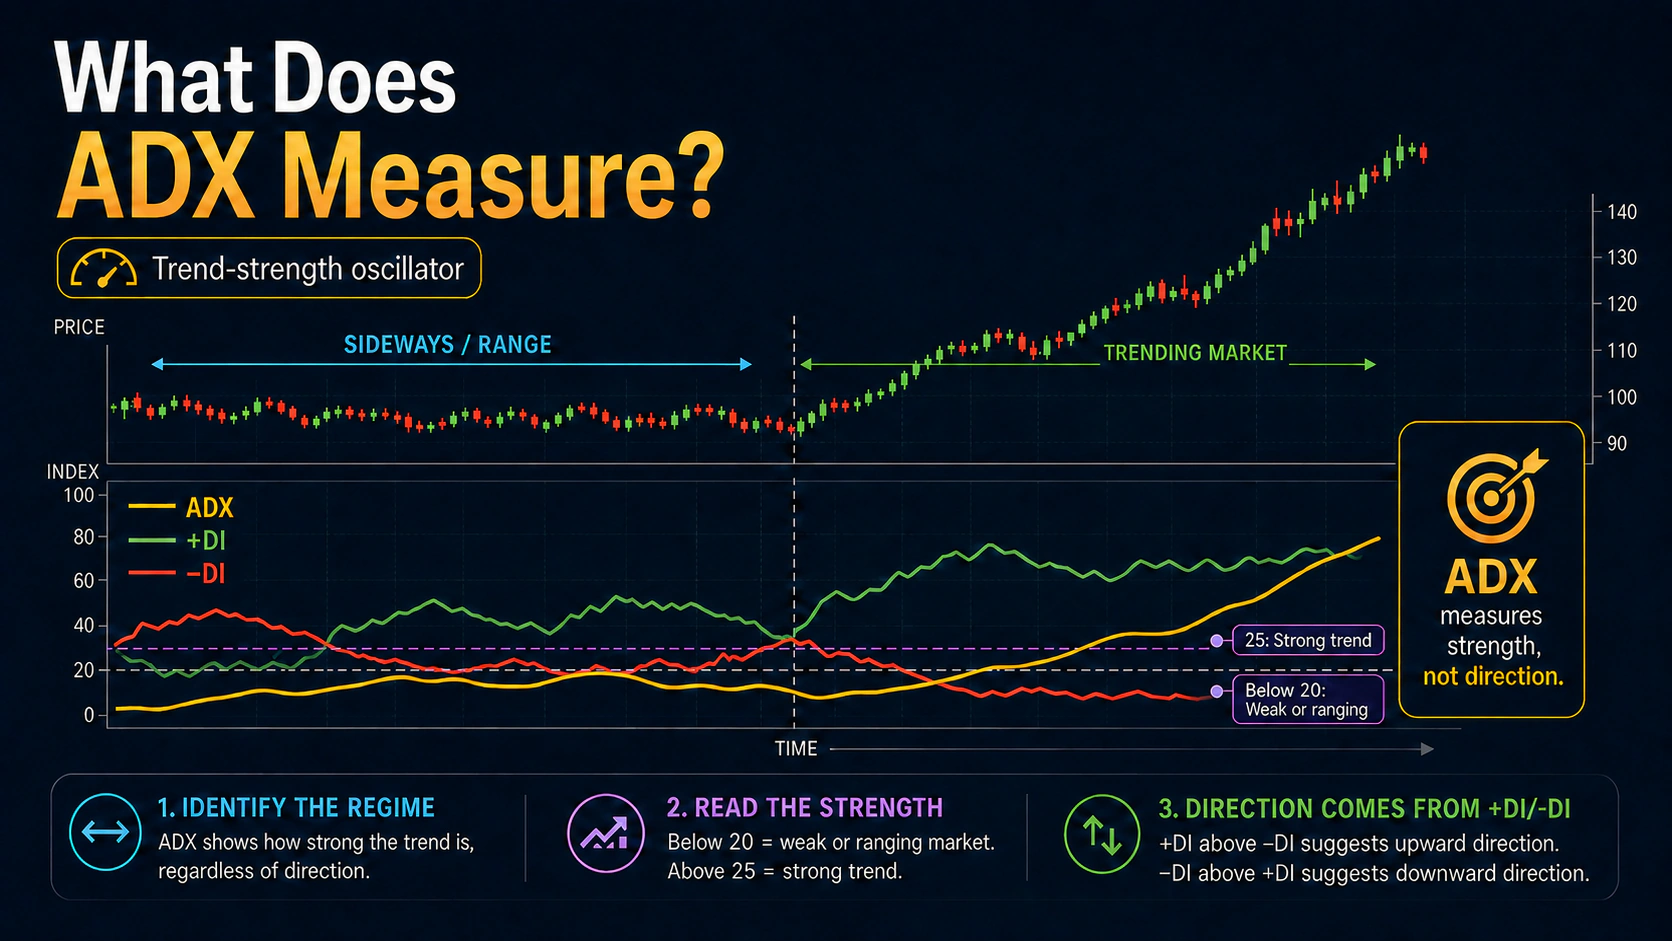
ADX is non-directional: a reading of 40 means a strong trend is in place, but says nothing about whether that trend is up or down. Direction comes from a separate pair of lines, +DI and -DI, that ADX is built on top of. This combination makes ADX most useful as a filter for deciding when trend-following strategies are worth using, rather than as a standalone directional signal.
Key Uses
- Trend strength assessment: decide whether a trend is strong enough to trade
- Market filter: avoid range-bound conditions, focus on trending ones
- Trend confirmation: validate signals generated by other indicators
- Breakout confirmation: gauge whether a price breakout has real strength behind it
How ADX Is Calculated
Step 1 — True Range (TR): the largest of High - Low, |High - Previous Close|, and |Low - Previous Close|.
Step 2 — Directional Movement:
- +DM = Current High - Previous High, if positive and greater than the corresponding -DM move, otherwise 0
- -DM = Previous Low - Current Low, if positive and greater than the corresponding +DM move, otherwise 0
Step 3 — Smoothing: TR, +DM, and -DM are each smoothed over 14 periods using Wilder’s method — the same approach used for ATR, where the first value is a 14-period sum and each value after that is the prior smoothed value minus one-fourteenth of itself, plus the current reading.
Step 4 — Directional Indicators:
- +DI = 100 × (Smoothed +DM ÷ Smoothed TR)
- -DI = 100 × (Smoothed -DM ÷ Smoothed TR)
Step 5 — DX and ADX:
- DX = 100 × |(+DI - -DI)| ÷ (+DI + -DI)
- ADX = a 14-period Wilder-smoothed average of DX
Charting platforms handle this calculation automatically — what matters for trading is reading the output correctly, covered below.
Reading ADX Values
| ADX Value | Trend Strength | Trading Implication |
|---|---|---|
| 0-25 | Weak or absent trend | Avoid trend-following strategies |
| 25-50 | Strong trend | Good for trend following |
| 50-75 | Very strong trend | Favorable trending conditions |
| 75-100 | Extremely strong (rare) | Watch for possible trend exhaustion |
+DI and -DI
- +DI above -DI: bullish directional bias
- -DI above +DI: bearish directional bias
- DI crossovers are more reliable when ADX is already above 25
ADX Settings by Trading Style
| Trading Style | ADX Period | Notes |
|---|---|---|
| Scalping | 7-10 | More sensitive, more noise |
| Day trading / swing trading | 14 (standard) | Balanced sensitivity |
| Position trading | 21-28 | Smoother, fewer signals |
Trading Strategies
1. Trend Strength Filter
Use ADX above 25 as a threshold for whether trend-following strategies — moving average crossovers, breakout trades — are worth using; below 25, favor range-bound approaches instead. A rising ADX adds confidence that a trend is strengthening.
2. DI Crossover
Buy when +DI crosses above -DI with ADX above 25 and rising; sell or short on the opposite crossover. Exit on the opposite DI crossover, or when ADX falls back below 25.
3. Breakout Confirmation
Use ADX above 25 and rising, together with +DI or -DI aligned with the breakout’s direction, to help separate a genuine breakout from a false one.
Combining ADX with Other Indicators
- Moving averages: only trade MA crossovers or bounces when ADX confirms a real trend is in place.
- RSI: a strong ADX plus an RSI extreme can flag a pullback within a trend rather than a reversal; a weak ADX plus an RSI extreme fits a range-bound reversal instead.
- MACD: ADX above 25 alongside a MACD crossover in the same direction adds confidence to the signal.
Limitations and Common Mistakes
- Using ADX for direction: ADX only measures strength — use +DI/-DI, not the ADX line itself, to read direction.
- Chasing a rising ADX from very high levels: readings above roughly 70-80 are rare and can mark trend exhaustion rather than more room to run.
- Treating ADX as a standalone signal: it works best as a filter alongside price action or another indicator, not as a trigger on its own.
- Over-optimizing the period: the 14-period default is well established; frequently retuning it adds little value.
FAQs
What does ADX measure exactly?
ADX measures trend strength on a scale from 0 to 100, regardless of direction. Values above 25 generally indicate a trending market; values below 25 suggest a weak or absent trend. It does not indicate which way the trend is moving.
How do you read ADX for trading?
Look at three things together: the ADX value (strength), the +DI/-DI relationship (direction), and whether ADX is rising or falling (strengthening or weakening). ADX above 25 and rising, with a clear DI separation, suggests good conditions for a directional trade.
What is a good ADX level for trading?
Values above 25 generally indicate a trending market suited to trend-following strategies. Values above 50 suggest a very strong trend, while values below 25 point to a choppier market better suited to range-trading approaches.
Can ADX predict trend reversals?
Not directly. Extremely high readings (roughly 70-80+) can sometimes coincide with trend exhaustion, but more reliable reversal cues come from ADX turning down from a high level combined with a DI crossover, not from the ADX value alone.
Should ADX be used alone for trading decisions?
No. ADX works best as a filter or confirmation tool. Combine it with price action, support/resistance, or another indicator such as moving averages or RSI.
Conclusion
ADX is valuable precisely because it doesn’t try to call direction — it tells you whether the current trend, whatever its direction, is strong enough to be worth trading with a trend-following approach. Readings above 25 favor trend strategies; readings below 25 favor range-bound ones. Pair ADX with +DI/-DI for direction and with price action for confirmation, and treat very high readings as a caution flag rather than a green light.