Moving Averages
Updated Aug 26, 2026
- Display Type
- Overlay
- Complexity
- Beginner to Advanced
- Best For
- Trend Following, Support/Resistance
On this page
Moving averages smooth out price action into a single line that shows the prevailing trend and can act as dynamic support or resistance. They are among the most widely used technical indicators and form the basis for tools such as MACD and Bollinger Bands. This guide covers the main moving average types, their formulas, how to choose between them, and common crossover strategies.
What Is a Moving Average?
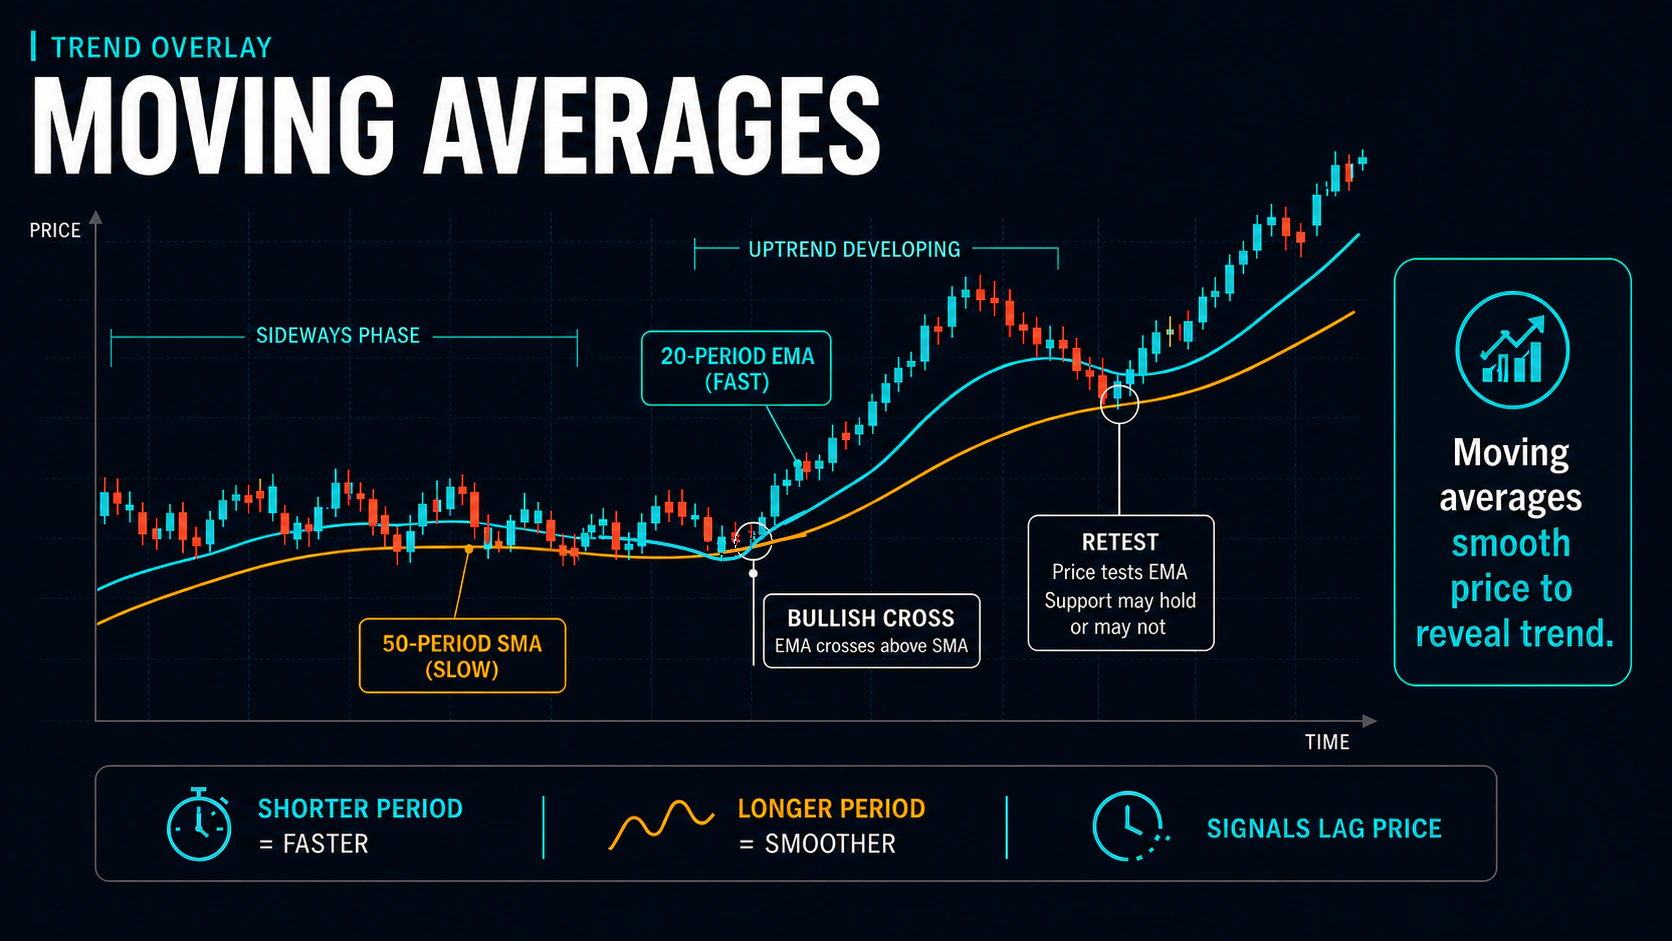
A moving average (MA) is the average price over a set number of periods, recalculated as each new period closes so the line “moves” along with price. Because it smooths out short-term noise, it’s used to read trend direction, locate potential support/resistance, and generate signals through crossovers.
Key Uses
- Trend identification: price above the MA suggests an uptrend, below suggests a downtrend
- Support and resistance: MAs often act as dynamic support/resistance levels
- Signal generation: crossovers between price and an MA, or between two MAs
- Smoothing: filters out noise to reveal the underlying trend
Types of Moving Averages
Simple Moving Average (SMA)
The SMA adds up the closing prices for a set number of periods and divides by that number.
SMA = (P1 + P2 + ... + Pn) / nWhere P = price and n = number of periods. Equal weight is given to every period, which makes the SMA slower to react but more stable than an EMA. Common periods: 20 (short-term), 50 (intermediate), and 200 (long-term, widely watched by institutions).
Two well-known SMA crossovers: a Golden Cross occurs when the 50 SMA crosses above the 200 SMA (bullish), and a Death Cross occurs when the 50 SMA crosses below the 200 SMA (bearish).
Exponential Moving Average (EMA)
The EMA gives more weight to recent prices, making it more responsive than the SMA.
EMA = (Close - Previous EMA) x Multiplier + Previous EMA
Multiplier = 2 / (n + 1)
Common periods: 9 (very short-term), 21 (short-term), and 55 (intermediate). MACD is built from a 12 and 26 EMA. The faster reaction time comes at a cost — EMAs are more prone to false signals in choppy, sideways markets than SMAs.
Weighted Moving Average (WMA)
The WMA assigns linearly decreasing weight to older prices, so the most recent close carries the most influence:
WMA = (P1 x n + P2 x (n-1) + ... + Pn x 1) / (n + (n-1) + ... + 1)where P1 is the most recent price. It sits between the SMA and EMA in responsiveness — more reactive than an SMA, without the exponential decay of an EMA.
Hull Moving Average (HMA)
Developed by Alan Hull in 2005, the HMA reduces lag while staying smooth by combining weighted moving averages of different lengths:
Raw  = 2 x WMA(n/2) - WMA(n)
HMA  = WMA(Raw, period = sqrt(n))
The result is a very responsive line with minimal lag, though it can overshoot in volatile conditions. It’s best suited to precision entry/exit timing rather than smooth long-term trend reads.
Triple Exponential Moving Average (TEMA)
TEMA reduces lag by combining three layered EMA calculations:
TEMA = 3 x EMA1 - 3 x EMA2 + EMA3where EMA1 is the EMA of price, EMA2 is the EMA of EMA1, and EMA3 is the EMA of EMA2. It’s smoother than a single EMA of the same length while reacting faster, at the cost of a more complex calculation and a tendency to overshoot in volatile swings.
Comparison Table
| MA Type | Responsiveness | Lag | Best For | Drawback |
|---|---|---|---|---|
| SMA | Low | High | Long-term trends | Slow to signal |
| WMA | Medium | Medium | General use | Still lags in fast moves |
| EMA | Medium-High | Medium | All-purpose | More false signals when choppy |
| HMA | Very High | Very Low | Entry/exit timing | Can overshoot |
| TEMA | High | Low | Trend confirmation | Complex, can overshoot |
Choosing an MA for Your Trading Style
Long-term investors
- Primary: 200 SMA Secondary: 50 SMA — stability matters more than responsiveness
Swing traders
- Primary: 21 EMA Secondary: 55 EMA — a balance of responsiveness and reliability
Day traders
- Primary: 9 HMA Secondary: 21 EMA — speed and precision matter most
Systematic/algorithmic traders
- Primary: TEMA or multiple EMAs — minimizing lag matters for automated entries
Trading Strategies
1. MA Crossover System
Buy when the fast MA crosses above the slow MA; sell when it crosses below. Common pairings: 50/200 SMA for position trading, or 9/21 EMA for swing trading.
2. Dynamic Support/Resistance
Buy when price bounces off a rising MA; sell when price is rejected at a falling MA. Works well with a 21 EMA or 50 SMA.
3. Multiple MA Alignment
A strong trend shows price stacked above (or below) a fast, medium, and slow MA in order — for example, price > 9 EMA > 21 EMA > 55 EMA in an uptrend. Trade in the direction of that alignment.
Related Indicators
- Volume Weighted Average Price (VWAP): incorporates volume and typically resets each session
- Smoothed Moving Average (SMMA): applies extra smoothing to reduce noise further
- MACD: built from a 12 and 26 EMA
- Bollinger Bands: a 20 SMA with standard-deviation bands
- RSI: use momentum to confirm MA-based signals
- ATR: use volatility to set stops around MA-based entries
Limitations and Common Mistakes
- MAs lag price: they’re built from historical data, so crossovers confirm a trend after it has already started rather than predicting it — that’s the trade-off for the noise filtering they provide.
- Whipsaws in choppy markets: crossover systems generate frequent false signals when price is range-bound; pair them with a trend-strength filter such as ADX.
- Stacking too many MAs: using more than two or three at once usually adds confusion rather than clarity.
FAQs
What are the main types of moving averages?
The most common are the Simple (SMA), Exponential (EMA), and Weighted (WMA) moving averages. More specialized variants include the Hull (HMA), Triple Exponential (TEMA), Smoothed (SMMA), and Volume Weighted (VWAP/VWMA).
Which moving average is best for day trading?
Short periods (5-21) matter more than the specific MA type. The 9 and 21 EMA are popular for their responsiveness; some traders prefer the Hull MA for its minimal lag.
Why do traders watch the 200-day moving average?
The 200 SMA covers roughly ten months of trading and is widely tracked by institutional investors, which makes it act as a psychological level and a common trend filter in automated systems.
What’s the difference between SMA and EMA?
The SMA weights every period equally; the EMA weights recent prices more heavily. That makes the EMA more responsive to new price changes but also more prone to false signals — the SMA tends to be better for reading the overall trend, the EMA for timing entries.
Can moving averages predict future prices?
No. Moving averages are lagging indicators built from past prices. They help confirm a trend or locate support/resistance, but they don’t forecast where price is headed next.
Conclusion
Moving averages remain fundamental to technical analysis because of their simplicity. There’s no single “best” type — the SMA and EMA cover most needs, while HMA and TEMA trade added complexity for reduced lag. Match the type and period to your timeframe, use them for confirmation rather than prediction, and combine them with other tools such as RSI or ATR for a complete picture.