SuperTrend
Updated Aug 26, 2026
- Display Type
- Overlay
- Complexity
- Beginner to Intermediate
- Best For
- Trend Following, Dynamic Support/Resistance, Entry/Exit Signals
On this page
SuperTrend is a trend-following overlay indicator, commonly attributed to French trader Olivier Seban, that plots a single line which sits below price during an uptrend (typically shown in green) and above price during a downtrend (typically shown in red). The line is built from the Average True Range (ATR), so it widens its distance from price during volatile periods and tightens during calmer ones, and it doubles as a trailing stop level for as long as the current trend holds.
What is SuperTrend?
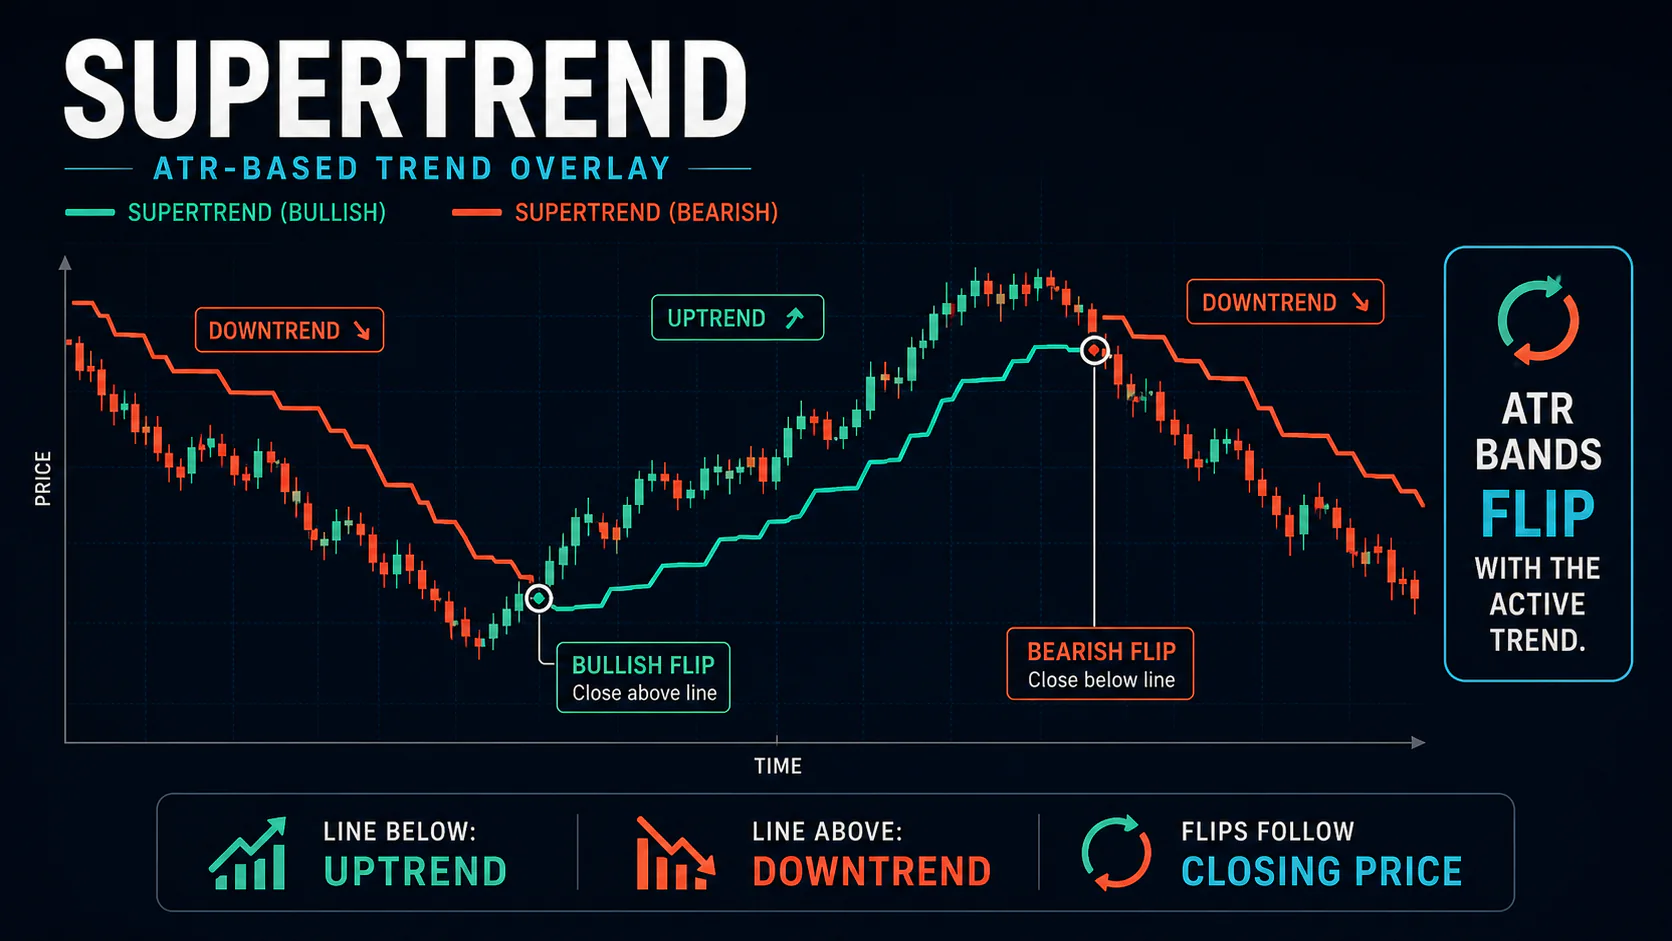
SuperTrend calculates two candidate bands from price and volatility, then follows whichever one is relevant to the current trend direction. In an uptrend it tracks the lower band as support; in a downtrend it tracks the upper band as resistance. The trend — and which band is being followed — flips the moment price closes through the current line.
Key Uses
- Trend Direction: Line position (above/below price) and color give an immediate trend read
- Trailing Stop Loss: The line itself serves as a stop that moves favorably as the trend progresses
- Entry/Exit Signals: A line flip marks a defined point where the trend is considered to have reversed
How SuperTrend Works
Formula
Basic Upper Band = (High + Low) / 2 + (Multiplier × ATR)
Basic Lower Band = (High + Low) / 2 − (Multiplier × ATR)
Default Parameters
- ATR period: 10
- Multiplier: 3.0
Band-Flip Logic
The basic bands recalculate every period, but the line that's actually plotted doesn't simply track them directly — it ratchets. In an uptrend, the plotted line follows the lower band, and that line is only allowed to rise or stay flat; it can never step down even if the basic lower band calculates to a lower value, which is what makes it function as a trailing stop. In a downtrend, the mirror applies: the plotted line follows the upper band, which is only allowed to fall or stay flat. The trend flips — switching which band is being tracked — the moment price closes through the current line: a close below the line while in an uptrend flips SuperTrend to the (falling) upper band and starts a downtrend; a close above the line while in a downtrend flips it to the (rising) lower band and starts an uptrend.
Signals
- Buy signal: price closes above the line while it's plotting as resistance (red), flipping the trend to bullish
- Sell signal: price closes below the line while it's plotting as support (green), flipping the trend to bearish
SuperTrend Characteristics
Because the line only moves in the trend-favorable direction between flips, the distance between price and the line tends to grow during a strong, sustained trend and stays small during choppy conditions — giving a rough visual read on trend strength in addition to direction. The ATR component means the line automatically widens during volatile stretches, which reduces (but doesn't eliminate) whipsaws compared to a fixed-distance trailing stop.
Standard Settings
ATR period 10 with a multiplier of 3.0 is the standard configuration used across most platforms and is a reasonable default for daily charts. Shorter ATR periods and lower multipliers (for example 7 and 2.0–2.5) make the line more responsive and generate more signals, at the cost of more whipsaws in choppy conditions; longer periods and higher multipliers produce smoother, less frequent signals better suited to longer-term positions. Any deviation from the 10/3.0 default should be back-tested on the specific instrument and timeframe rather than assumed from a generic rule of thumb.
Trading Strategies
Basic Trend Following
Enter in the direction of a line flip, place an initial stop just beyond the line, and hold the position as SuperTrend trails it. Exit — or reverse — on the next opposite flip.
Pullback Entries
In an established trend, a pullback that touches the SuperTrend line followed by a rejection candle in the trend direction can offer a better-positioned entry than chasing the initial flip, with a tight stop just beyond the line (commonly around one ATR).
Multiple SuperTrend Confirmation
Running two or three SuperTrend calculations at different settings (for example a faster ATR-7/multiplier-2 alongside the standard ATR-10/multiplier-3) and only trading when they agree can filter out lower-conviction signals, at the cost of fewer total trades. Divergence between a faster and slower SuperTrend is often read as an early warning that the trend may be losing momentum.
Combining SuperTrend with Other Indicators
RSI pulling out of oversold while SuperTrend is bullish (or out of overbought while bearish) adds a momentum check to the trend signal. A longer-term moving average (20/50 EMA) provides broader trend context so SuperTrend signals against that context can be filtered out or treated with more caution. Volume confirmation on the bar where SuperTrend flips helps separate a high-conviction reversal from a weak one likely to fail.
Market Conditions
SuperTrend performs well in sustained trends, where the line holds one color for extended stretches and price stays consistently on one side of it. It performs poorly in range-bound markets, where price whipsaws across the line and generates frequent, low-quality flips — reducing position size or switching to a range-appropriate strategy is the standard response. In highly volatile conditions the ATR widening keeps the line further from price, which reduces whipsaws but also means wider stops and fewer, later signals.
Common Mistakes
- Trading every flip regardless of context: filter signals with the broader trend or another indicator rather than acting on color changes alone.
- Using default settings on every instrument: back-test ATR period and multiplier for the specific market and timeframe rather than assuming the defaults are optimal everywhere.
- Ignoring the higher-timeframe trend: a SuperTrend flip against the dominant trend on a higher timeframe is a lower-probability signal.
- Poor stop placement: stops belong just beyond the SuperTrend line, not at an arbitrary distance.
FAQs
What are the best SuperTrend settings?
ATR 10 with a 3.0 multiplier is the standard and a reasonable default. Shorter timeframes sometimes use lower multipliers (2.0–2.5) for faster signals; longer-term charts sometimes use higher multipliers (3.5–4.0) for smoother ones.
Can SuperTrend be used alone?
It can generate complete entry, exit, and stop signals by itself, but combining it with a momentum indicator like RSI or a longer-term trend filter generally improves signal quality, particularly in choppier markets.
How is SuperTrend different from a moving average?
SuperTrend's ATR component makes it adapt to volatility rather than simply averaging price, and it flips discretely between two states (support/resistance) rather than moving continuously — which gives clearer visual signals but a more abrupt response to reversals.
How do you set stops with SuperTrend?
Place the stop just beyond the current SuperTrend line — often around one ATR beyond it — and let it trail as the line moves favorably; it should never be moved against the trend.
Why does SuperTrend generate false signals?
Mainly in range-bound markets, where price oscillates across the line repeatedly. News-driven volatility and gap opens can also trigger flips that don't reflect a genuine trend change.
Conclusion
SuperTrend's appeal is its simplicity: a single ATR-based line that gives a clear, color-coded trend read and a trailing stop in one indicator. Its band-flip mechanic — the line only ever moving in the trend-favorable direction between reversals — is what makes it function as a genuine trailing stop rather than a simple moving average. Like other trend-following tools, it performs best in trending conditions and generates more noise in a range, so pairing it with a trend filter or momentum indicator and adapting the ATR multiplier to the instrument's volatility remain the key practical adjustments.