Parabolic SAR
Updated Aug 26, 2026
- Display Type
- Overlay
- Complexity
- Beginner to Intermediate
- Best For
- Trend Following, Stop Loss Placement, Entry/Exit Signals, Trend Reversal Detection
On this page
Parabolic SAR (Stop and Reverse) is a trend-following overlay indicator, developed by J. Welles Wilder Jr. and introduced in his 1978 book "New Concepts in Technical Trading Systems," that plots a series of dots above or below price. The dots trail price and accelerate as a trend matures, functioning simultaneously as a trend-direction signal and a trailing stop level. Wilder himself noted that SAR is a trend-following tool and recommended pairing it with a trend-strength filter such as ADX, since it performs poorly when a market is not actually trending.
What is Parabolic SAR?
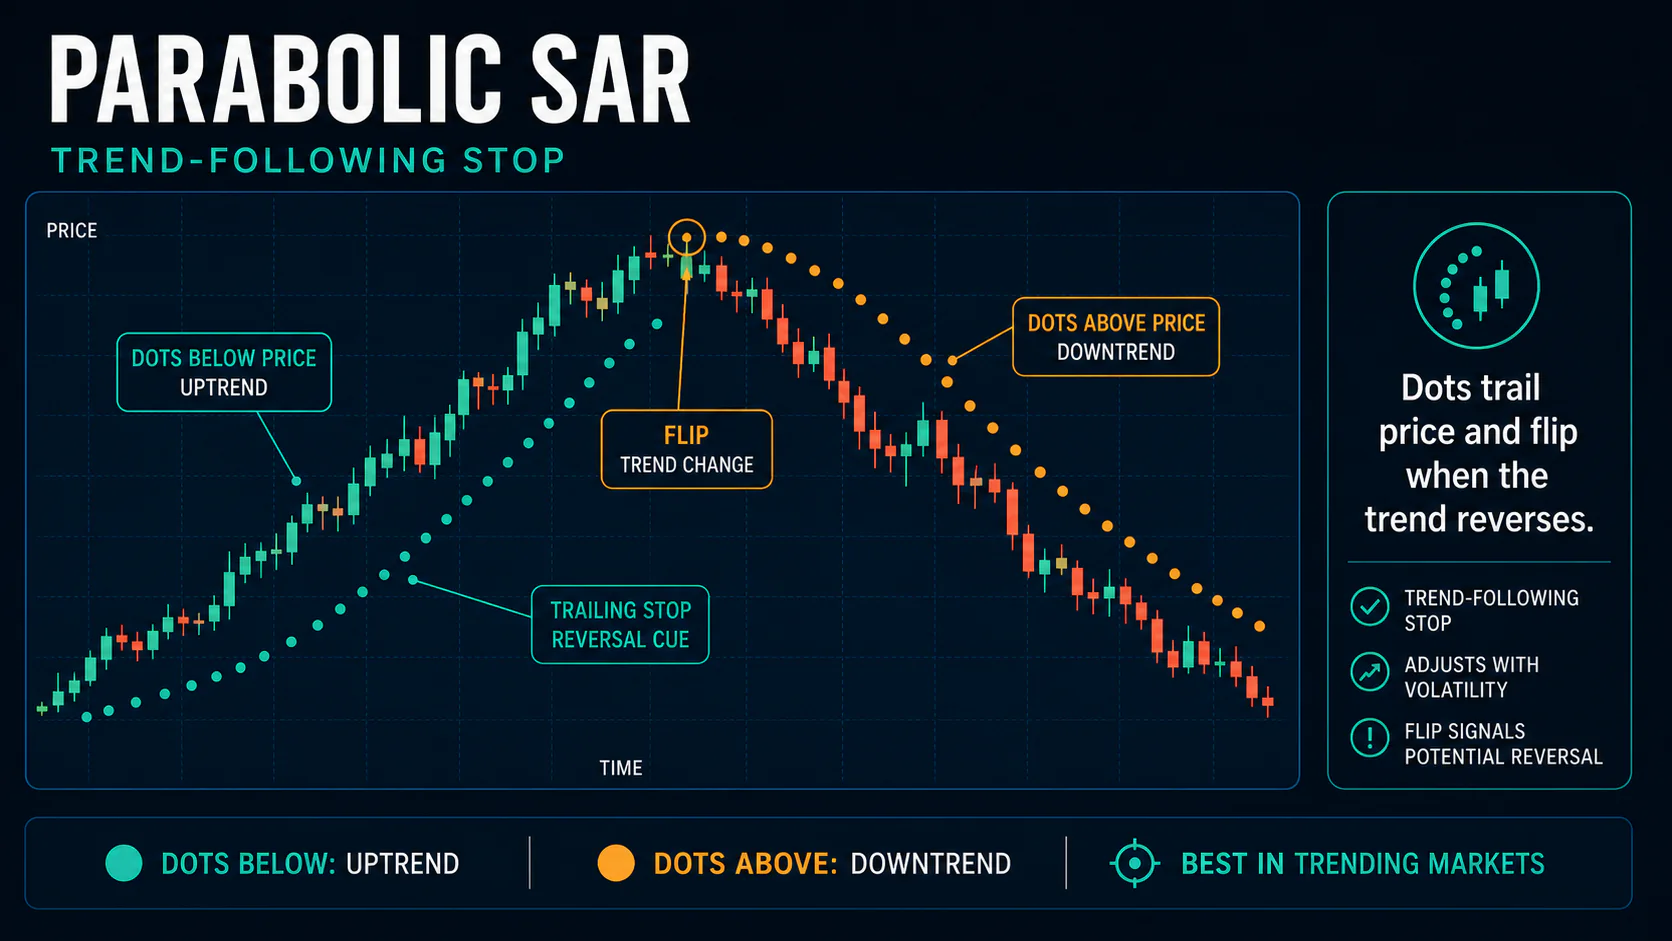
Dots below price indicate an uptrend; dots above price indicate a downtrend. As a trend continues, the dots accelerate toward price — creating the curved, "parabolic" shape that gives the indicator its name — until price eventually touches or crosses a dot, at which point the trend is considered to reverse and the dots flip to the other side. This stop-and-reverse structure means the indicator is always positioned in the market, one direction or the other, with no neutral state.
Key Uses
- Trend Direction: Dot position (above/below price) gives an immediate read on trend bias
- Trailing Stop Loss: The dot itself functions as a stop level that tightens as the trend matures
- Reversal Signals: A dot flip marks a defined, objective point where the trend is considered to have changed
How Parabolic SAR Works
Formula
SAR(next) = SAR(current) + AF × [EP − SAR(current)]
Where AF is the acceleration factor and EP (extreme point) is the highest high reached during the current uptrend, or the lowest low reached during the current downtrend. The same formula drives both directions; only the extreme point and the starting SAR value (set from the prior swing's high or low) differ between an uptrend and a downtrend calculation.
Acceleration Factor
- Starting value: 0.02
- Increment: +0.02 each time price makes a new extreme point (a new high in an uptrend, a new low in a downtrend) — not simply every period
- Maximum: 0.20 (Wilder's original cap)
This means AF only increases when the trend makes fresh progress; during a pause or pullback within the trend, AF holds steady rather than continuing to climb.
Calculation Rules
- In an uptrend, SAR cannot be set above either of the prior two periods' lows — this keeps the stop from moving faster than price structure allows.
- In a downtrend, SAR cannot be set below either of the prior two periods' highs.
- The trend reverses — and AF resets to 0.02 — the moment price touches or crosses the SAR dot.
Parabolic SAR Characteristics
The acceleration factor is what gives SAR its distinctive behavior: dots stay relatively far from price early in a trend, then tighten progressively as the trend persists and makes new extremes, protecting profit as the move matures. This also means SAR's stop level, unlike a fixed percentage or ATR-based stop, gets objectively tighter over time regardless of volatility — which is part of why it eventually catches every trend, including trends that later resume in the same direction (a whipsaw).
Standard Settings
The default 0.02 / 0.02 / 0.20 configuration (starting AF, increment, maximum AF) is the standard across virtually all platforms and works reasonably well as a starting point on most timeframes. Traders sometimes lower the maximum AF (e.g., to 0.10) for smoother, later signals on longer-term charts, or raise the starting AF and maximum for faster, more sensitive signals intraday — but these adjustments trade signal frequency for whipsaw risk in both directions and should be back-tested on the specific instrument rather than assumed.
Trading Strategies
Trend Following
Enter in the direction a dot flip indicates, using the new dot (or the prior one) as an initial stop, and let the SAR trail the position as a stop-loss for as long as the trend continues. Exit — or reverse — when the dots flip to the other side.
Breakout Confirmation
When price breaks a horizontal support or resistance level, checking that SAR has already flipped (or flips concurrently) to the same side adds confirmation that momentum, not just a single bar, supports the move. A breakout with SAR still on the opposite side, or a SAR that just reversed moments earlier, is a weaker signal and more prone to failure.
Pullback Entries
In an established trend — SAR consistently on one side of price for many periods — a minor pullback toward the SAR dots followed by a bounce can offer a lower-risk entry than chasing the initial flip, with a tight stop just beyond the SAR level.
Combining Parabolic SAR with Other Indicators
Because SAR performs poorly outside of trending conditions, pairing it with a trend or trend-strength filter addresses its biggest weakness directly. A long-term moving average (e.g., price above/below the 200-day) can restrict trades to the direction of the larger trend, and Wilder's own suggestion — ADX above roughly 25 — can be used to skip SAR signals altogether when the market isn't trending strongly enough for the indicator to be reliable. ADX and SAR are complementary for exactly this reason: SAR gives direction and stop placement, ADX gives a read on whether the market is trending at all. Volume confirmation on the bar where SAR flips can also help distinguish a high-conviction reversal from a low-volume, likely-to-fail one.
Market Conditions
SAR performs well in sustained trends, where it captures the bulk of the move with relatively few whipsaws and its trailing-stop behavior protects gains as the trend matures. It performs poorly in ranging markets: price crossing back and forth causes the dots to flip repeatedly, generating a string of small losses as the acceleration factor keeps resetting. In volatile, choppy conditions the same problem is amplified — wider stops beyond the SAR level, or simply avoiding SAR-based entries until ADX or another trend filter confirms a real trend, are the standard responses.
Common Mistakes
- Trading every SAR flip regardless of market structure: without a trend filter, SAR generates frequent false reversals in a range.
- Ignoring the broader trend context: taking a SAR signal that runs counter to the higher-timeframe trend increases the odds of a whipsaw.
- Using default settings unconditionally: volatile, choppy instruments may warrant a lower maximum AF for smoother, less reactive signals.
- Poor position sizing: position size should be calculated from the distance between entry and the current SAR stop level, not set arbitrarily.
FAQs
How is Parabolic SAR different from moving averages?
SAR accelerates toward price as a trend matures and flips sides entirely on a reversal, while a moving average is a smoother, continuous line that doesn't reset. SAR responds faster to trend changes but produces more false signals in non-trending markets.
What are the best Parabolic SAR settings?
The standard 0.02 / 0.02 / 0.20 works for most applications. A lower maximum (around 0.10) smooths signals for longer-term charts; a higher starting value and maximum increase sensitivity for shorter timeframes at the cost of more whipsaws.
How do you avoid SAR whipsaws?
Add a trend filter — a long-term moving average or, as Wilder suggested, ADX — and avoid taking SAR signals when the broader market structure looks range-bound rather than trending.
Can Parabolic SAR be used as a standalone system?
It can generate complete entry, exit, and stop levels on its own, but it performs meaningfully better paired with a trend filter, since SAR itself has no way to tell a real trend from a temporary swing.
How do you size positions using SAR?
Use the dollar distance from entry price to the current SAR stop level to determine position size for a given amount of capital at risk, the same way you would with any other stop-based method.
Conclusion
Parabolic SAR is a simple, objective trend-following tool: it gives an unambiguous direction reading and a trailing stop level in one line, with no room for subjective interpretation of where the stop should sit. Its central weakness is equally simple — it performs poorly whenever the market isn't actually trending, since the stop-and-reverse mechanic that makes it effective in trends turns into a series of whipsaws in a range. Used with a trend filter like ADX or a longer moving average, and with position sizing tied to the SAR stop distance, it remains a practical tool for mechanically riding and protecting trending moves.