Bollinger Bands
Updated Aug 26, 2026
- Display Type
- Overlay
- Complexity
- Beginner to Intermediate
- Best For
- Mean Reversion, Volatility Analysis, Support/Resistance
On this page
Bollinger Bands are a volatility-based overlay that plots two bands around a moving average, widening and narrowing as market volatility changes. Created by John Bollinger in the 1980s, they combine a trend read (the middle band), a volatility read (band width), and a relative-price read (position within the bands) in one indicator. This guide covers the formula, how to read squeezes and band walks, practical strategies, and where the indicator misleads traders.
What Are Bollinger Bands?
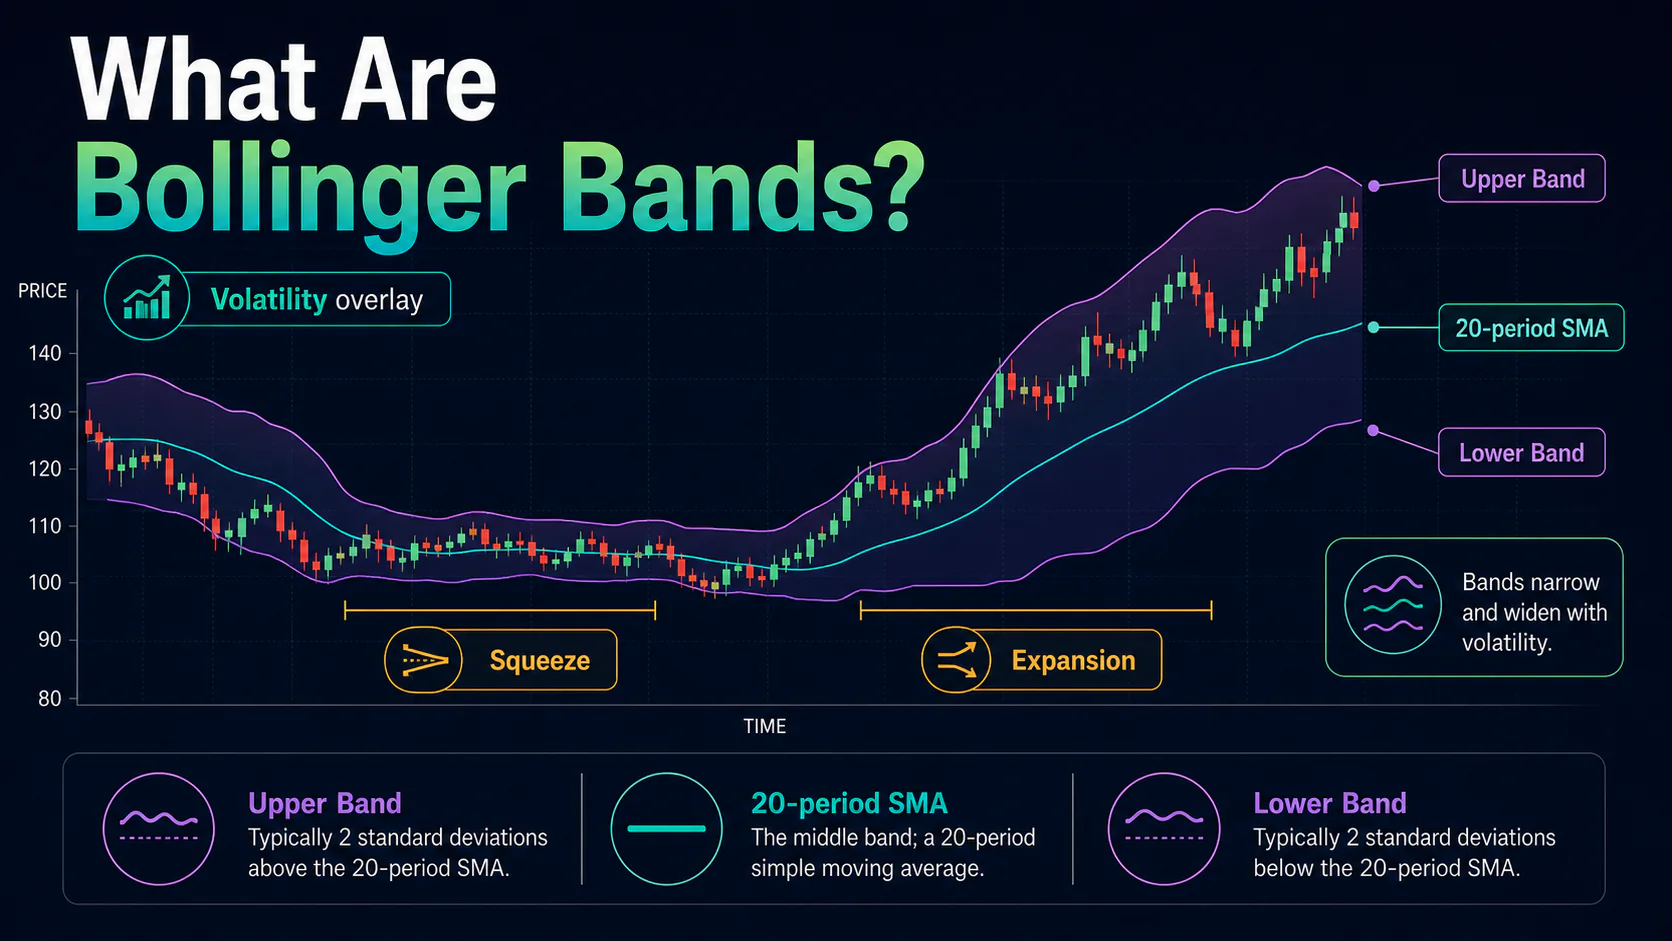
Bollinger Bands consist of three lines plotted on a price chart:
- Middle Band: a 20-period simple moving average
- Upper Band: middle band + (2 × standard deviation of the same 20 closes)
- Lower Band: middle band - (2 × standard deviation of the same 20 closes)
Because the bands are built from a rolling standard deviation, they expand automatically in volatile conditions and contract in quiet ones — the bands adapt to the market rather than sitting a fixed distance from price.
Key Uses
- Volatility measurement: band width shows current volatility levels
- Mean reversion signals: price reaching a band can flag a potential turning point
- Breakout setup: a band squeeze often precedes a larger price move
- Dynamic support/resistance: the bands act as moving reference levels
How Bollinger Bands Are Calculated
Standard deviation: SD = √[Σ(Price - SMA)² ÷ n], where Price is each period’s close, SMA is the 20-period average, and n = 20.
Under a normal distribution, roughly 95% of values fall within 2 standard deviations of the mean, which is why 2 SD is the standard band width — though real price data isn’t perfectly normal, so bands get touched or exceeded somewhat more often than that approximation suggests.
Reading the Bands
The Squeeze
A “squeeze” occurs when the bands contract sharply, reflecting a period of unusually low volatility. Volume typically thins out and price consolidates near the middle band. A squeeze often precedes a larger move in either direction, but it gives no clue which way price will break — treat it as a signal to watch closely, not a directional call.
Band Walks
When price consistently hugs one band rather than reverting to the middle, it signals strong trend momentum rather than an imminent reversal.
- Upper band walk: price stays near or above the upper band during a strong uptrend — don’t expect an immediate pullback.
- Lower band walk: price stays near or below the lower band during a strong downtrend — “oversold” at the lower band doesn’t mean a bounce is due.
%B and Bandwidth
%B shows where price sits within the bands: %B = (Price - Lower Band) ÷ (Upper Band - Lower Band). A %B above 1.0 means price is above the upper band; 0.5 means price is at the middle band; below 0.0 means price is below the lower band.
Bandwidth measures the distance between the bands: (Upper Band - Lower Band) ÷ Middle Band × 100. It’s a numerical way to spot a squeeze and compare volatility across different periods.
Bollinger Band Settings
| Trading Style | Period | Std Dev | Notes |
|---|---|---|---|
| Scalping | 10 | 1.9 | Faster reversals, more noise |
| Day trading | 20 | 2.0 | Standard settings |
| Swing trading | 20 | 2.1 | Slightly wider bands |
| Position trading | 50 | 2.0 | Long-term trend context |
Trading Strategies
1. Mean Reversion (Band Bounce)
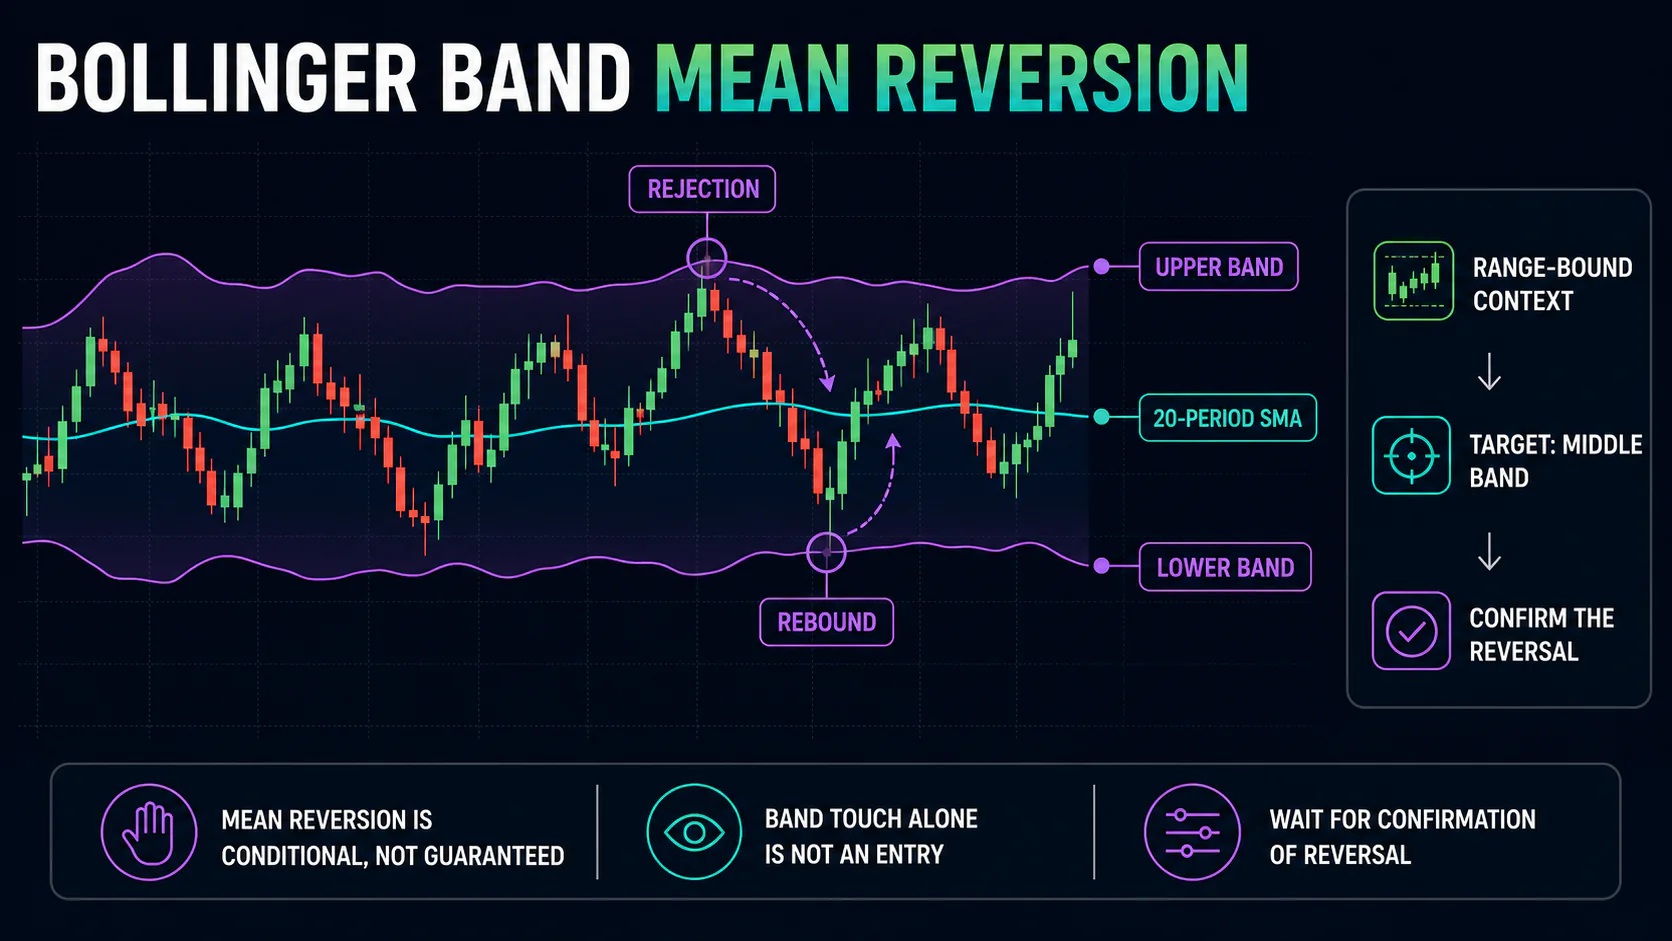
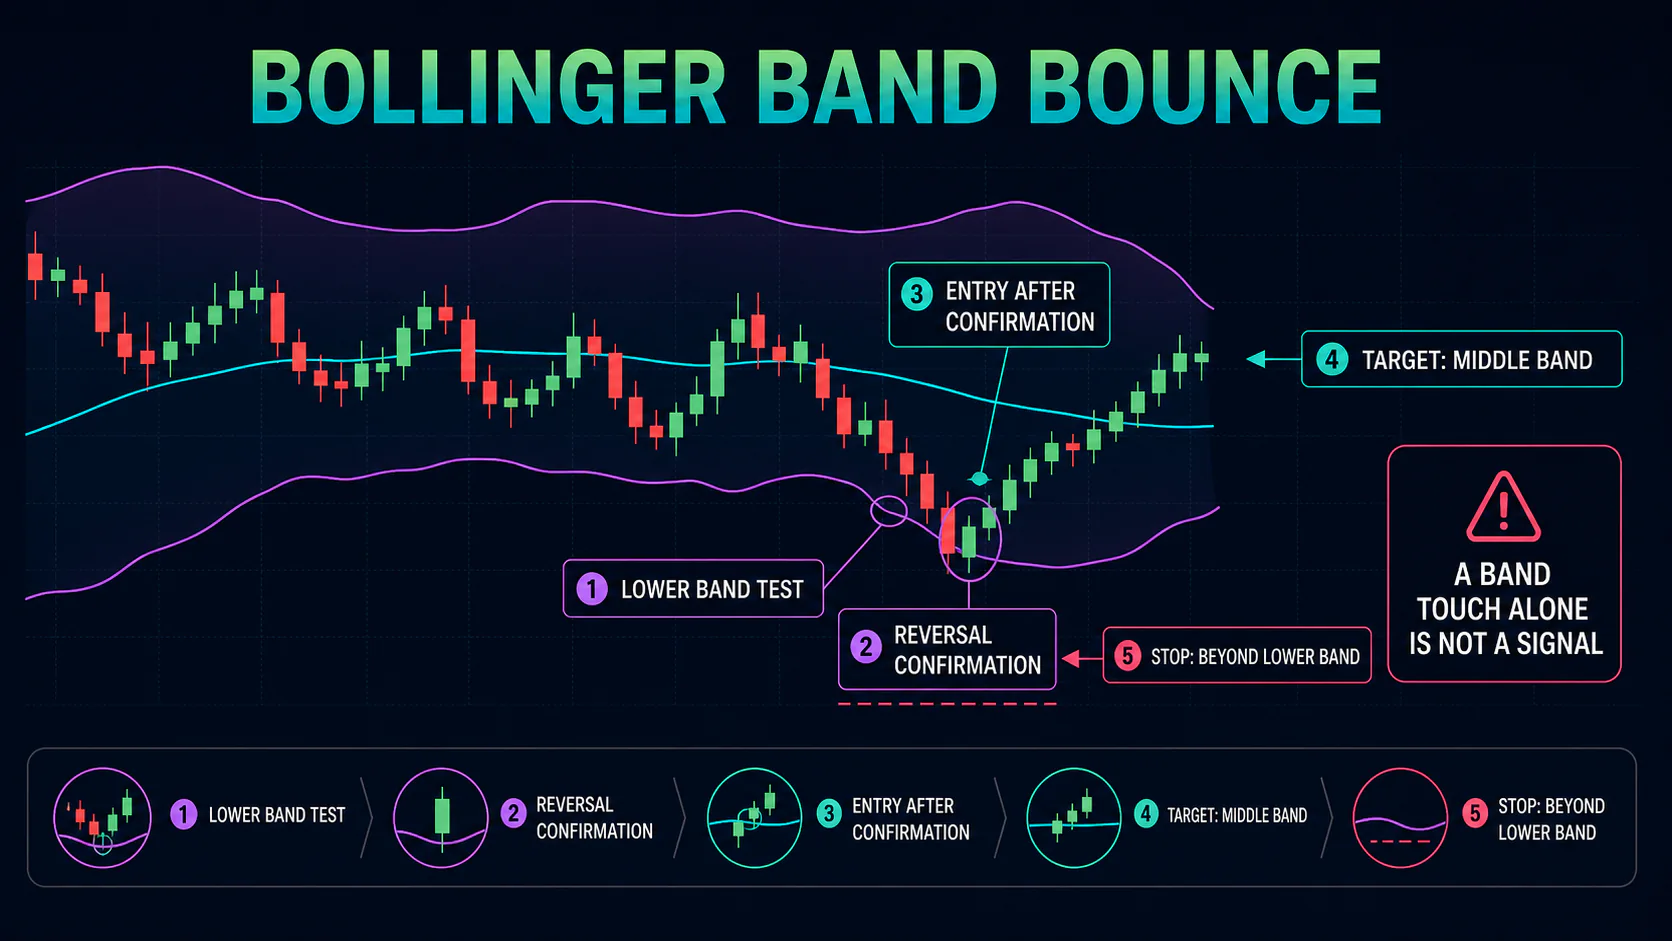
Setup: price touches or exceeds a band without a clear trend in place. Entry: fade the move — sell near the upper band, buy near the lower band. Target: the middle band. Stop: beyond the touched band. This works best in range-bound conditions with normal volatility; confirm with RSI divergence, a volume spike, or a reversal candlestick rather than trading the band touch alone.
2. Squeeze Breakout
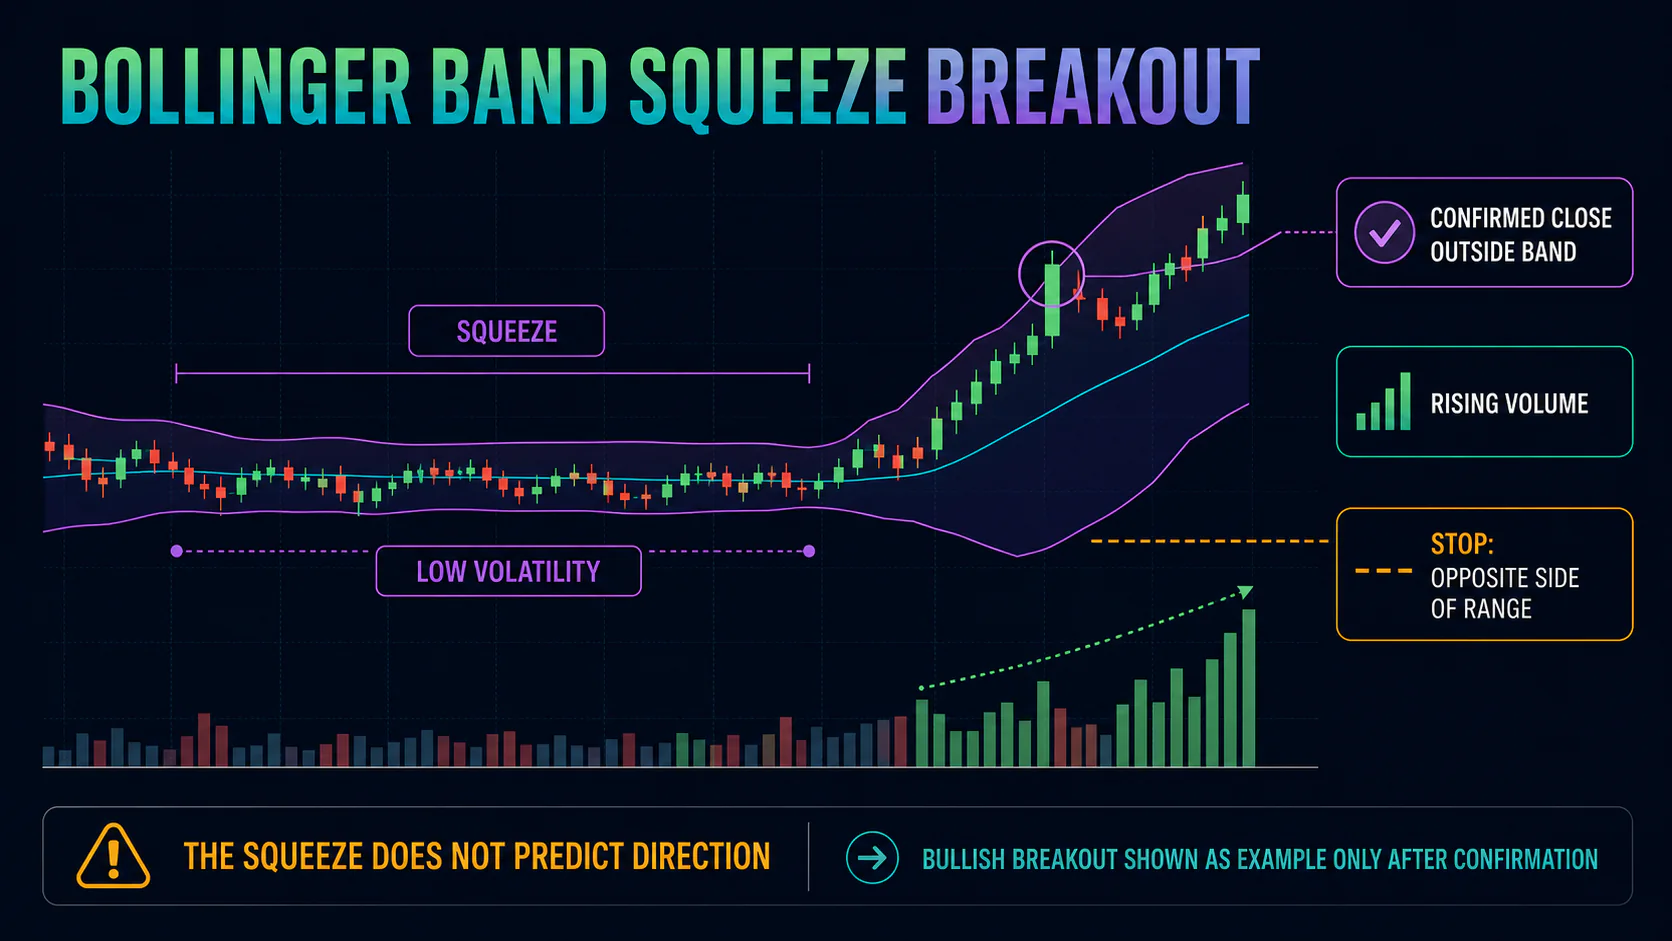
Setup: the bands contract to an unusually narrow range. Entry: trade the breakout direction once price closes outside a band on rising volume — don’t guess the direction from the squeeze itself. Target: the prior swing high or low. Stop: the opposite side of the squeeze range. False breakouts are common, so wait for a confirmed close rather than a brief poke outside the band.
3. Band Walk
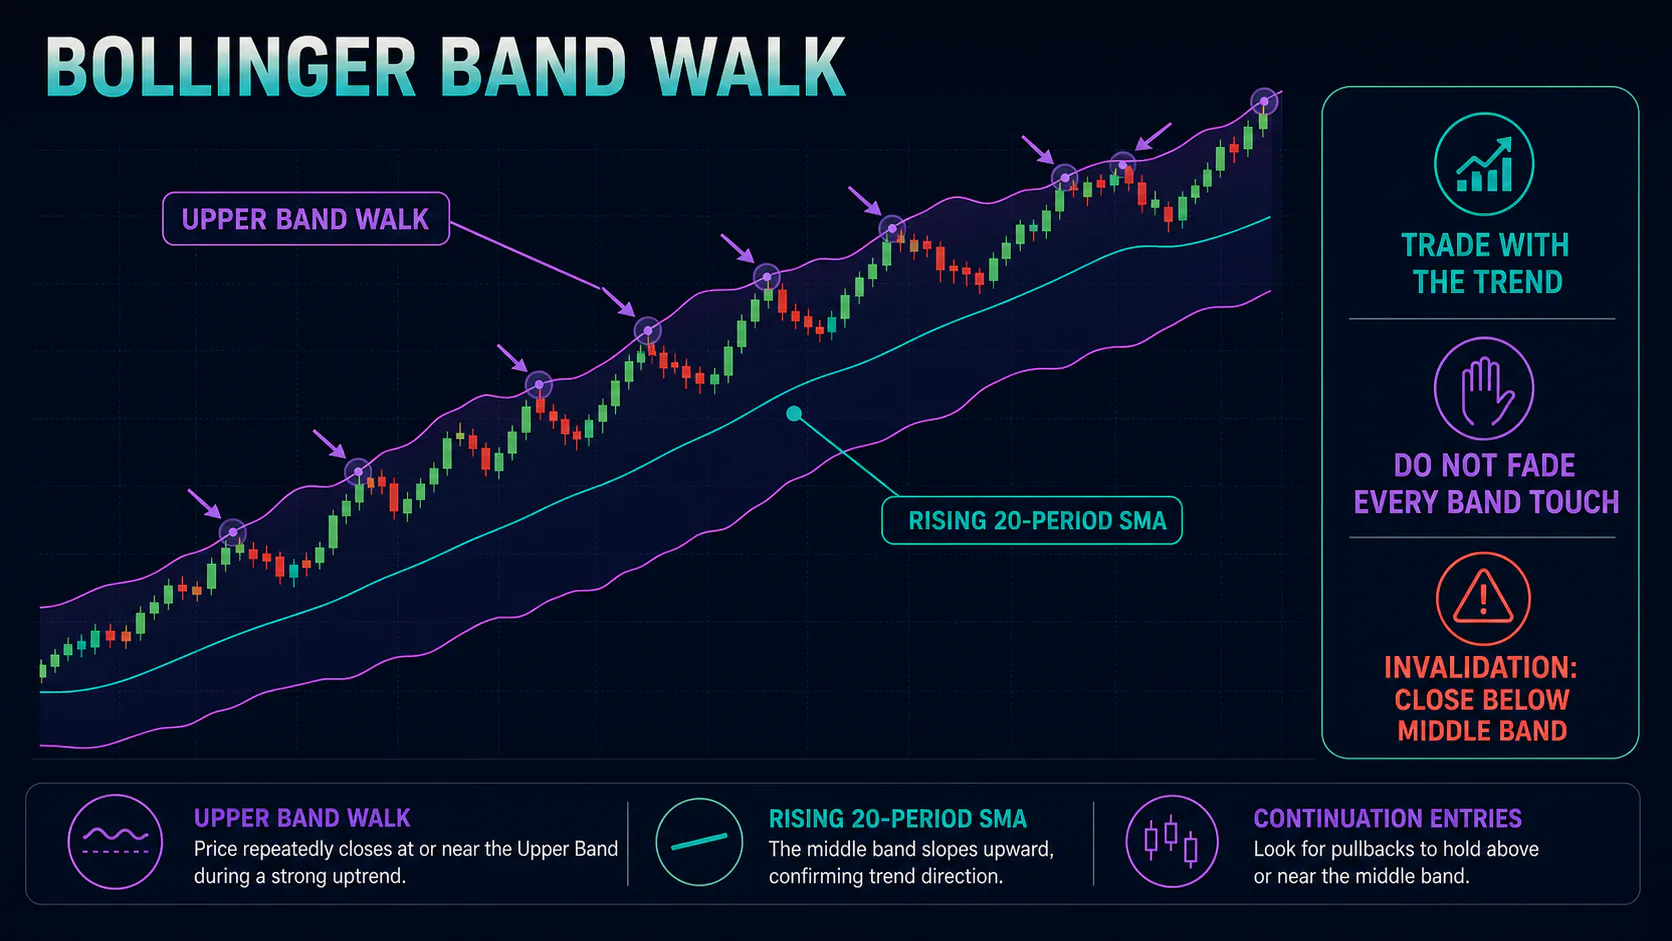
Setup: price repeatedly closes at or beyond one band during a strong trend. Entry: trade with the trend rather than fading it — a band touch here is a symptom of strength, not exhaustion. Target: extended price objectives. Stop: a close back through the middle band. Band walks can run longer than expected, so don’t anticipate an early reversal.
Combining Bollinger Bands with Other Indicators
- RSI: an RSI extreme lining up with a band touch is a stronger reversal signal than either alone; watch for RSI divergence at the bands.
- Volume: high volume on a band touch or breakout adds confidence; a low-volume squeeze is the classic setup for a breakout still to come.
- MACD: MACD divergence combined with a band touch, or histogram direction combined with a squeeze, helps read the likely breakout direction.
Limitations and Common Mistakes
- A band touch isn’t a signal by itself: in a trend, price can walk along a band for an extended stretch without reversing. Fading every touch is a common way to lose money in trending markets.
- The squeeze doesn’t predict direction: low volatility flags that a bigger move is likely coming, not which way it will break.
- Fixed settings in changing conditions: the standard 20-period, 2.0 SD setup can produce more false signals during unusually high-volatility stretches; some traders widen to 2.5 SD in that environment.
- Ignoring the underlying trend: mean-reversion strategies at the bands work far better in range-bound markets than in strongly trending ones.
FAQs
What do Bollinger Bands tell you?
They provide three things at once: trend direction from the middle band’s slope, volatility level from the band width, and relative price position from where price sits within the bands.
How do you read Bollinger Bands for buying and selling?
Prices touching the lower band can suggest a potential buying opportunity, and prices touching the upper band a potential selling opportunity — but in a strong trend, price can walk along a band for a while, so confirm with another indicator before fading the move.
What is a good Bollinger Band setting?
The standard setting (20-period, 2 standard deviations) works well for most situations. Shorter-term traders sometimes use a 10-period band; longer-term investors sometimes use 50.
What does it mean when the bands are tight?
Tight, or “squeezed,” bands indicate low volatility and often come before a larger price move — the compression reflects a period of consolidation ahead of a potential breakout in either direction.
Can Bollinger Bands predict market direction?
No. The squeeze can suggest a significant move is coming, but the bands themselves don’t indicate which direction — that call requires additional analysis such as price structure, volume, or another indicator.
Conclusion
Bollinger Bands remain widely used because they adapt automatically to changing volatility rather than relying on a fixed distance from price. The key to using them well is context: identify low-volatility squeeze setups, use mean reversion in range-bound markets, and recognize band walks as a sign of trend strength rather than an automatic reversal cue. Combine them with another indicator or price action rather than trading band touches on their own.