Keltner Channels
Updated Aug 26, 2026
- Display Type
- Overlay
- Complexity
- Beginner to Intermediate
- Best For
- Trend Following, Dynamic Support/Resistance, Breakout Analysis, Volatility Analysis
On this page
Keltner Channels are a volatility-based overlay indicator that plots bands above and below a moving average, widening in volatile conditions and narrowing during quiet ones. Chester W. Keltner introduced an early version in his 1960 book "How to Make Money in Commodities," using a moving average of the typical price with bands based on the high-low range. Linda Bradford Raschke popularized the version now in common use in the 1980s, which replaces the raw range with the Average True Range (ATR) for a more consistent volatility measure — the two versions shouldn't be conflated, since they use different inputs for both the centerline and the bands.
What are Keltner Channels?
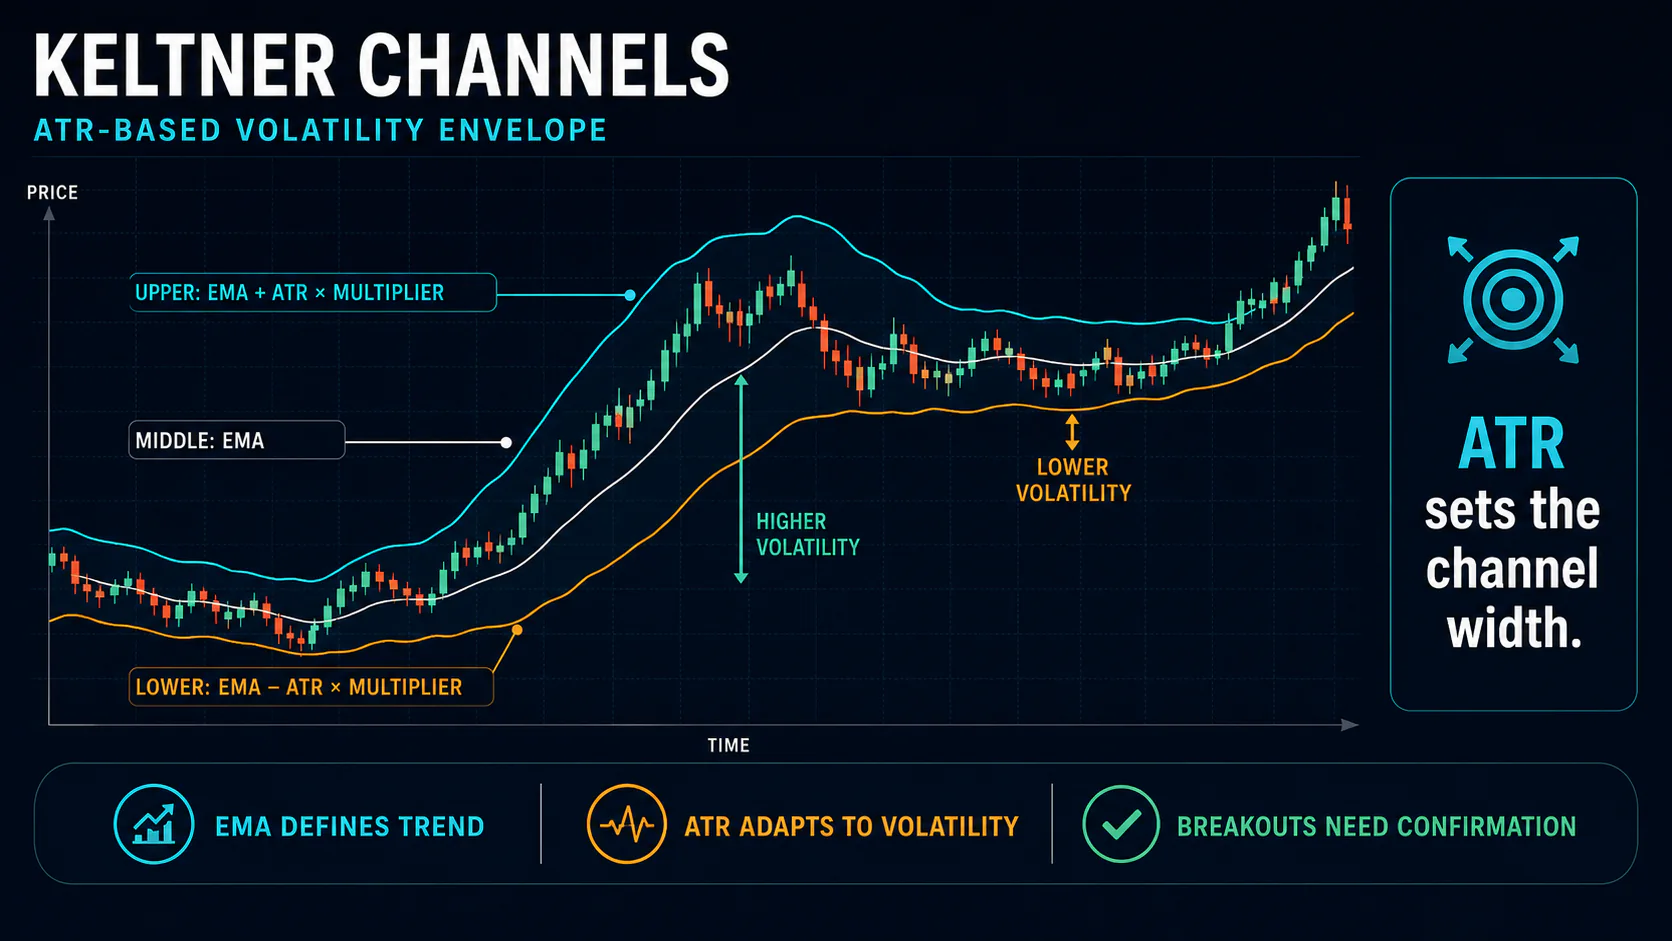
The modern version consists of three lines: a middle line (an exponential moving average), an upper band (the EMA plus a multiple of ATR), and a lower band (the EMA minus the same multiple of ATR). The middle line tracks trend direction while the bands define a volatility-adjusted normal range — moves that push outside the bands are read as unusual relative to recent volatility, which can signal either a breakout or an overextension depending on context.
Key Uses
- Trend Direction: The middle line's slope shows the prevailing trend
- Dynamic Support/Resistance: Bands adjust to volatility rather than staying fixed
- Breakout Analysis: A close outside the bands flags an unusual, potentially significant move
- Volatility Assessment: Band width itself is a read on current volatility level
How Keltner Channels Work
Formula
Middle Line = 20-period EMA (of closing price, or optionally the typical price)
Upper Band = EMA + (Multiplier × ATR)
Lower Band = EMA − (Multiplier × ATR)
Default Parameters
- EMA period: 20
- ATR period: 10
- Multiplier: 2.0
Some platforms match the ATR period to the EMA period (both 20) instead of using 10; either convention is in use, but the EMA(20)/ATR(10)/multiplier-2 combination is the most commonly cited default.
Reading the Channel
- Expanding bands: rising volatility, often during a trending or breakout phase
- Contracting bands: falling volatility, often during consolidation — a pronounced contraction ("squeeze") is frequently watched as a setup ahead of a volatility expansion, though the direction of the eventual move isn't determined by the squeeze itself
- Price above the upper band: strong bullish momentum, though this can also reflect a short-term overextension
- Price below the lower band: strong bearish momentum, or a short-term oversold extreme
- Price inside the channel: normal range-bound movement, with the middle line providing directional bias
Trading Strategies
Breakout
A decisive close beyond a band, ideally with volume and with the channel already sloping in the breakout direction, is treated as a trend-initiation signal. Stops typically sit at the opposite band or the middle line, with position size scaled to the current ATR.
Squeeze
When the bands narrow well below their recent range, it signals reduced volatility that has often preceded a larger move historically — though not reliably enough to predict direction. Traders typically wait for the first decisive break out of the squeeze and enter in that direction, since the squeeze itself only flags that a move may be coming, not which way.
Mean Reversion
In range-bound conditions, a touch of a band that doesn't produce a decisive break — especially alongside a momentum divergence — can be traded back toward the middle line or the opposite band. This approach performs poorly in strongly trending markets, where price can walk along a band for an extended stretch without reverting.
Combining Keltner Channels with Other Indicators
RSI divergence at a band extreme adds a momentum-based reason to expect a reversion trade to work, while RSI aligned with a breakout direction supports taking the breakout at face value. Volume separates genuine breakouts (rising volume) from likely false ones (light volume). MACD can serve a similar confirming role — a MACD crossover in the same direction as a channel breakout adds conviction, while MACD divergence at a band extreme flags a possible reversal.
Market Conditions
Keltner Channels work well in trending markets, where the sloped middle line and one-sided band touches confirm trend direction and offer pullback entries. In range-bound markets the channel contracts and provides clear boundaries for mean-reversion trades, with squeeze/breakout combinations flagging when the range may be ending. In volatile conditions the bands expand quickly to absorb larger swings — useful for avoiding false breakout signals, but it also means stops need to widen accordingly and position sizes should be reduced to compensate.
Common Mistakes
- Ignoring the middle line's slope: trading against the broader channel direction reduces the odds of a signal working.
- Taking every band touch as a signal: require a decisive close beyond the band, plus volume, rather than a brief touch.
- Using fixed stops instead of volatility-based ones: stop distance should scale with ATR and channel width, not a fixed dollar or percentage amount.
- Applying mean reversion in a trending market: match the strategy (breakout vs. reversion) to the current channel behavior.
Settings by Market
The standard EMA(20)/ATR(10)/multiplier-2.0 setup is a reasonable starting point across stocks, forex, and futures. More volatile instruments, including many cryptocurrencies, sometimes use a wider multiplier (around 2.5–3.0) or a shorter EMA to stay responsive; more stable instruments sometimes narrow the multiplier slightly. Any adjustment should be back-tested on the specific instrument rather than applied by assumption.
FAQs
How do Keltner Channels differ from Bollinger Bands?
Keltner Channels use ATR for band width, while Bollinger Bands use standard deviation of price. ATR-based bands tend to be smoother and react somewhat differently to volatility spikes than standard-deviation bands.
What's the best timeframe for Keltner Channels?
They work on any timeframe. Daily charts are the most common application for swing trading; intraday charts suit day trading but produce noisier signals.
How do you identify a channel squeeze?
Watch for band width — the distance between upper and lower bands — contracting well below its recent range, usually alongside ATR sitting near a relative low.
Can Keltner Channels predict market direction?
No — they're a reactive, trend-following tool, not a predictive one. A squeeze flags that a bigger move may be coming without indicating which way it will go.
What's the significance of the middle line?
It represents trend direction and often acts as dynamic support in an uptrend or resistance in a downtrend; it's commonly used as a trailing-stop reference in trend-following approaches.
How do you handle false breakouts?
Require a closing price beyond the band rather than an intraday touch, look for volume confirmation, and check alignment across at least one higher timeframe before treating a break as valid.
Conclusion
Keltner Channels combine a trend-following moving average with volatility-adjusted bands, giving traders a framework that works for both trend continuation and mean-reversion approaches depending on market context. The ATR-based bands automatically widen and narrow with volatility, which helps filter noise during quiet periods without needing to manually resize a fixed-width channel. As with any volatility-based tool, the channel reacts to price rather than predicting it — its value comes from combining it with a read on the broader trend and a plan for which strategy (breakout or reversion) fits current conditions.