Ichimoku Cloud
Updated Aug 26, 2026
- Display Type
- Overlay
- Complexity
- Intermediate to Advanced
- Best For
- Trend Analysis, Support/Resistance, Momentum Analysis, Complete Market Overview
On this page
Ichimoku Cloud (Ichimoku Kinko Hyo, roughly "one-glance equilibrium chart") is a multi-part overlay indicator developed by Japanese journalist Goichi Hosoda in the 1960s and published in 1969. It combines five lines to display trend direction, momentum, and support/resistance in a single view, including two lines projected forward and one projected backward relative to current price.
What is Ichimoku Cloud?
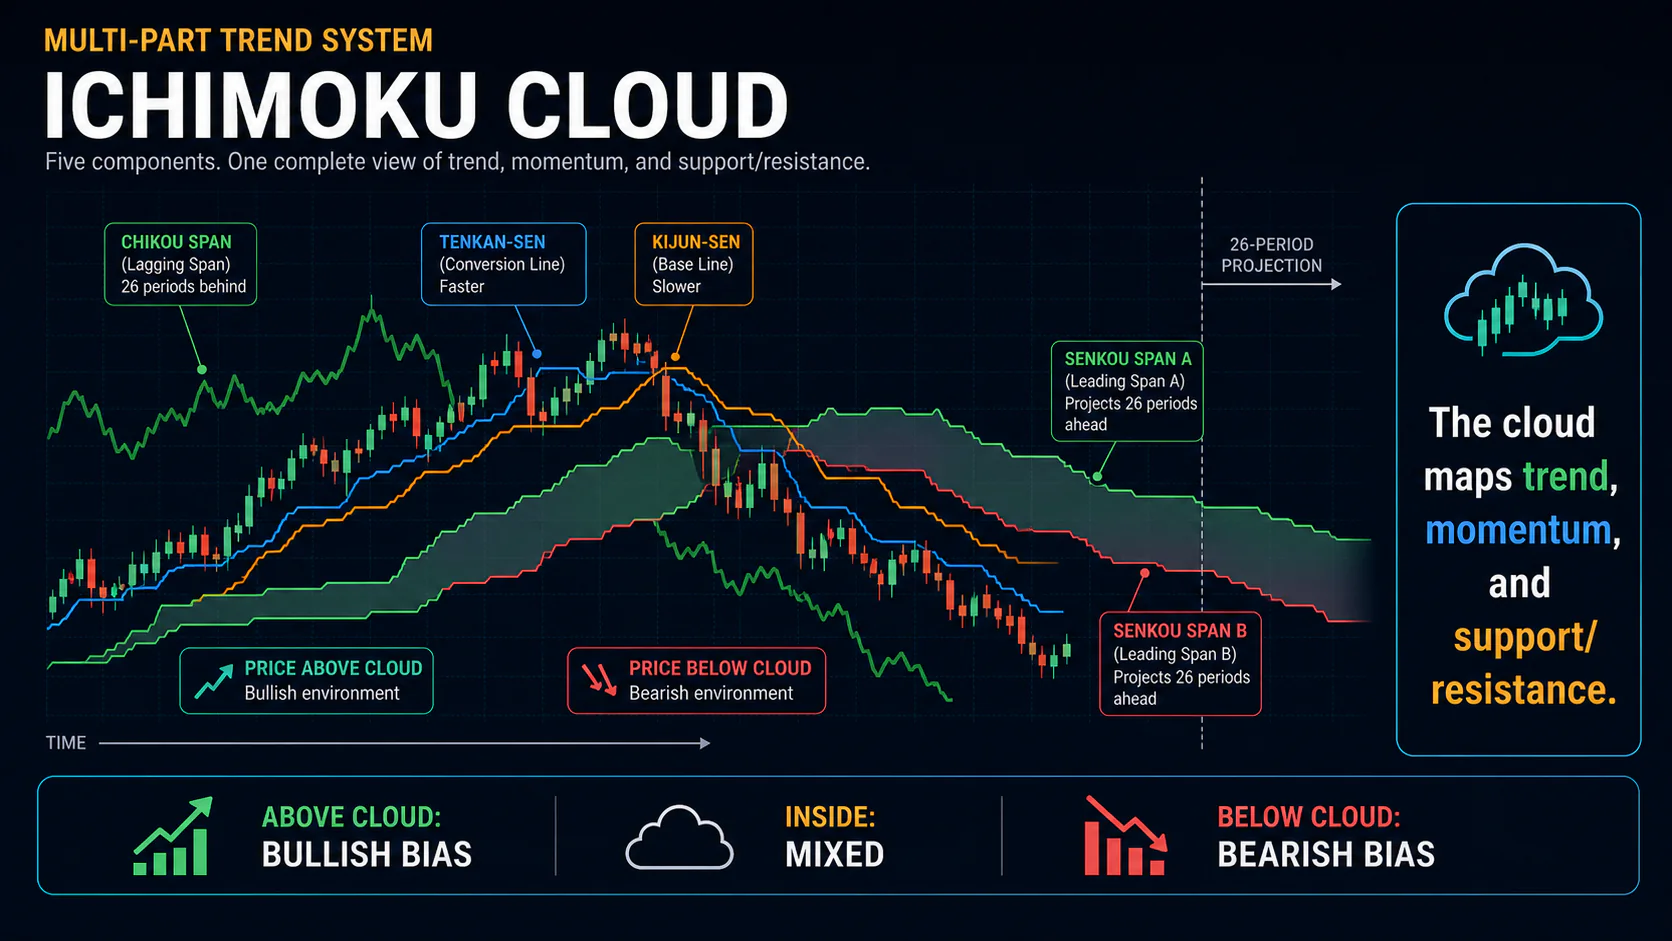
The system consists of five lines: Tenkan-sen (Conversion Line), Kijun-sen (Base Line), Senkou Span A (Leading Span A), Senkou Span B (Leading Span B), and Chikou Span (Lagging Span). The "cloud" (Kumo) is the shaded area between Senkou Span A and Senkou Span B, plotted 26 periods ahead of current price, forming a support/resistance zone that projects into the future. Despite the name, none of the component lines are moving averages of closing prices — each is a midpoint of the highest high and lowest low over its lookback period.
Key Uses
- Trend Identification: Price position relative to the cloud shows the prevailing bias
- Dynamic Support/Resistance: The cloud's edges act as evolving support and resistance
- Momentum Analysis: Tenkan/Kijun crossovers flag shorter-term momentum shifts
- Signal Confirmation: The Chikou Span and multiple line interactions cross-check each other
The Five Components
Tenkan-sen (Conversion Line): (9-period High + 9-period Low) / 2 — a fast line reflecting short-term price midpoints; Tenkan/Kijun crossovers are a common signal trigger.
Kijun-sen (Base Line): (26-period High + 26-period Low) / 2 — a slower midpoint line that often acts as dynamic support or resistance and is used as a trend reference.
Senkou Span A (Leading Span A): (Tenkan-sen + Kijun-sen) / 2, plotted 26 periods ahead of the current bar — forms one edge of the cloud.
Senkou Span B (Leading Span B): (52-period High + 52-period Low) / 2, plotted 26 periods ahead — forms the other edge of the cloud and, using a longer lookback, tends to move more slowly than Span A.
Chikou Span (Lagging Span): the current close plotted 26 periods behind. It is used to confirm other signals — Chikou sitting clear of past price action in the direction of the trade is taken as a sign of momentum, while Chikou tangled with past price suggests indecision.
Default Parameters
- Tenkan-sen period: 9
- Kijun-sen period: 26
- Senkou Span B period: 52
- Forward/backward displacement: 26 periods
Reading the Cloud
- Bullish cloud: Senkou Span A above Senkou Span B (typically shaded green)
- Bearish cloud: Senkou Span B above Senkou Span A (typically shaded red)
- Cloud thickness: a thicker cloud implies a stronger support/resistance zone; a thin cloud is more easily broken
- Cloud twist: the point where Span A and Span B cross signals a potential future shift in support/resistance, 26 periods before it occurs
Price above the cloud is read as a bullish bias, with the cloud acting as support below. Price below the cloud is read as a bearish bias, with the cloud acting as resistance above. Price inside the cloud signals consolidation or a transition — most traders wait for a clear break of the cloud rather than trading a directional bias while price is inside it.
Trading Strategies
Cloud Breakout
A bullish breakout sets up when price closes above the cloud with the Tenkan-sen above the Kijun-sen and the Chikou Span sitting clear above past price; the mirror image applies to bearish breakouts below the cloud. Because the cloud edges are known 26 periods in advance, traders can also note whether the cloud price is about to enter is thick or thin, bullish or bearish, before the breakout happens.
Tenkan/Kijun Cross
A cross of the Tenkan-sen above the Kijun-sen is a bullish signal, most reliable when price is already above the cloud and the Chikou Span is trending upward; a cross below is the bearish mirror. Crosses that occur while price is inside the cloud, or against the cloud's direction, are considerably less reliable and are a common source of false signals.
Full System Alignment
The strongest setups occur when all the components agree: price above (or below) the cloud, Tenkan-sen above (or below) Kijun-sen, both lines sloping in the trade direction, the Chikou Span clear of past price in the same direction, and the cloud ahead colored in the same direction. Partial alignment — for example a TK cross with price still inside the cloud — is a weaker, lower-conviction signal. A cloud edge or the Kijun-sen line are commonly used as trailing stop references.
Combining Ichimoku with Other Indicators
Volume confirmation strengthens cloud breakouts and TK crosses — a breakout on light volume is more likely to fail. RSI divergence at a cloud edge, or RSI aligned with the direction of a TK cross, adds a momentum check that helps filter out weak signals. Fibonacci retracement levels sometimes coincide with cloud edges or the Kijun-sen, and confluence between the two can mark a higher-probability zone, though this is a matter of the levels lining up rather than the two systems being formally linked.
Market Conditions
Ichimoku performs best in sustained trends, where the cloud provides a clear directional bias and TK crosses occur cleanly in the trend direction. In ranging markets, price is often trapped inside the cloud, TK crosses whipsaw, and the Chikou Span can be congested against past price — in this environment it's better to wait for a clear cloud breakout than to trade every crossover. In highly volatile conditions the faster lines (Tenkan-sen, Kijun-sen) can whipsaw even as the cloud itself provides more stability; widening stops and requiring stronger confirmation helps offset the extra noise.
Common Mistakes
- Ignoring the Chikou Span: skipping this confirmation check discards one of the system's built-in filters.
- Trading inside the cloud: directional trades taken while price is inside the cloud have a weaker edge — wait for a clear break.
- Misreading time displacement: confusing the forward-projected Senkou spans with the backward-projected Chikou Span leads to misinterpreting what each line is telling you.
- Trading every TK cross: crosses are far more reliable when read alongside price's position relative to the cloud.
- Ignoring cloud direction ahead: the color and thickness of the cloud 26 periods forward is already known and worth checking before entering.
Settings by Market
The standard 9/26/52 settings work across most markets and timeframes, including forex and stock indices. Some traders using 24/7 markets like crypto scale the settings down proportionally (for example 7/22/44) to compensate for the faster cycle, but this is a matter of preference rather than a documented edge, and the standard settings remain the most widely used and back-tested starting point. Any adjustment should keep the roughly 1:3:6 ratio between the three periods intact.
FAQs
What makes Ichimoku different from other indicators?
It combines trend, momentum, and support/resistance in one system and is the only common indicator with components deliberately plotted both ahead of and behind current price.
How do you read the cloud's color?
A cloud where Senkou Span A sits above Senkou Span B is typically shaded green (bullish); the reverse is typically shaded red (bearish). A "twist," where the spans cross, flags a potential future change in the cloud's bias.
What is the strongest Ichimoku signal?
Full alignment of all five components in the same direction — price relative to the cloud, the TK cross, the Chikou Span, and the cloud's forward color all agreeing.
Can Ichimoku be used for day trading?
Yes, typically on 1-hour or 4-hour charts, though signals on very short timeframes are noisier and benefit from confirmation on a higher timeframe.
How should Ichimoku be handled in ranging markets?
Favor cloud breakouts over TK crosses, since crosses whipsaw more in a range, and treat price trapped inside the cloud as a sign to wait rather than trade a bias.
What does "clear space" mean for the Chikou Span?
It means the Chikou Span (the close plotted 26 periods back) isn't overlapping the price action from that period — clear space above suggests bullish momentum, clear space below suggests bearish momentum.
Conclusion
Ichimoku Cloud packages trend, momentum, and support/resistance analysis into a single, internally consistent system built around price midpoints projected forward and backward in time. Its cloud formation gives traders support and resistance levels that are known in advance, which is a genuinely distinctive feature among technical indicators. The tradeoff is a steeper learning curve than single-line indicators, and its full value only shows up when the components are read together rather than in isolation — a TK cross or a Chikou reading on its own is a weaker signal than the same reading confirmed by the rest of the system.