ATR (Average True Range)
Updated Aug 26, 2026
- Display Type
- Oscillator
- Complexity
- Beginner
- Best For
- Volatility Analysis, Stop Loss Placement, Position Sizing
On this page
Average True Range (ATR) is a technical indicator developed by J. Welles Wilder Jr. in 1978 that measures how much an asset typically moves over a given period, expressed in price units rather than direction. It’s built from the True Range — the largest of a few possible price-range measurements for each period — smoothed over time. This guide covers the formula and how to use ATR for stop placement and position sizing.
What Does ATR Measure?
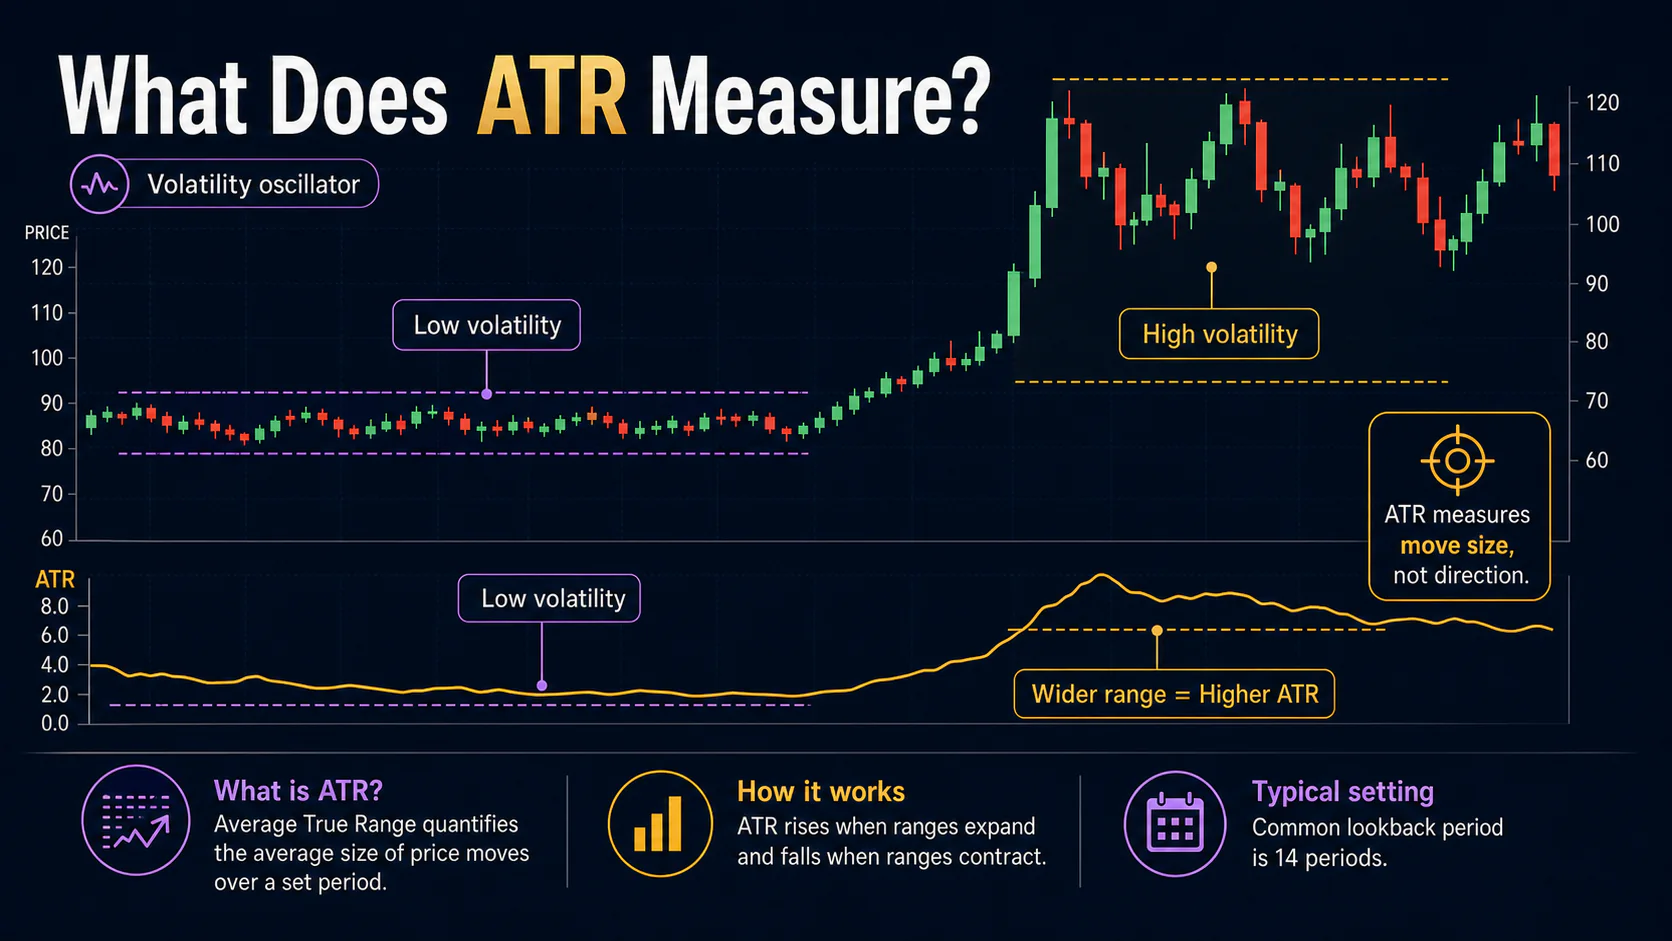
ATR is non-directional: it says nothing about whether price is likely to rise or fall, only how large a move is “normal” for the asset right now. Because it’s expressed in the same units as price (dollars, pips, points), it’s a practical building block for stop distances and position sizes that adapt to current volatility instead of using a fixed distance regardless of conditions.
Key Uses
- Stop loss placement: set stops based on normal volatility rather than an arbitrary distance
- Position sizing: adjust trade size to the current volatility level
- Volatility analysis: gauge whether current conditions are calm or turbulent relative to history
- Trailing stops: adjust stops dynamically as volatility changes
How ATR Is Calculated
True Range is the largest of:
- Current High - Current Low
- |Current High - Previous Close|
- |Current Low - Previous Close|
Using the largest of the three, rather than just High - Low, captures gaps between sessions that a simple daily range would miss.
ATR is a 14-period Wilder-smoothed average of True Range:
- First ATR = simple average of the first 14 True Range values
- Each ATR after that = [(Previous ATR × 13) + Current TR] ÷ 14
Interpreting ATR
| ATR Condition | Implication | Trading Consideration |
|---|---|---|
| High ATR | Increased volatility | Wider stops, smaller positions |
| Low ATR | Decreased volatility | Tighter stops, potential breakout setup |
| Rising ATR | Volatility expanding | Trend may be accelerating |
| Falling ATR | Volatility contracting | Market consolidating |
Judge ATR relative to the asset’s own recent history rather than against a fixed number — a reading that’s notably above or below its own recent average is more informative than the raw value on its own.
ATR Settings by Trading Style
| Trading Style | ATR Period | Notes |
|---|---|---|
| Scalping | 5-10 | More sensitive, frequent changes |
| Day trading / swing trading | 14 (standard) | Balanced responsiveness |
| Position trading | 21-50 | Very stable readings |
Trading Applications
1. Stop-Loss Placement
A common approach multiplies ATR by a factor — roughly 1× ATR for a tight stop that’s more likely to be hit by normal noise, up to 2-3× ATR for a wider stop with more room to breathe but a larger loss if the trade is wrong. Example: stock price $100, ATR $2.50, using a 2× ATR stop places the stop at $100 - (2 × $2.50) = $95.
2. Position Sizing
Risk-based position sizing uses the ATR-based stop distance to size the trade: decide the dollar risk per trade (e.g., 1% of account equity), calculate the stop distance in dollars using ATR, then divide risk amount by stop distance. Example: $10,000 account, 1% risk = $100, ATR $2.00 with a 2× ATR stop = $4.00 stop distance, so position size = $100 ÷ $4.00 = 25 shares.
3. Bands, Trailing Stops, and ATR%
ATR shows up in several derived tools: ATR bands plot price ± a multiple of ATR, similar to Bollinger Bands but using ATR instead of standard deviation; ATR trailing stops trail price by a multiple of ATR (commonly 2-3×) and move only in the trade’s favor; and ATR% (ATR ÷ Close × 100) normalizes ATR so volatility can be compared across assets at different price levels.
Combining ATR with Other Indicators
- Moving averages: set a stop a multiple of ATR beyond an MA-based support/resistance level rather than at an arbitrary distance.
- Bollinger Bands: a Bollinger Band squeeze paired with low ATR reinforces a consolidation read; band expansion paired with rising ATR confirms a volatility breakout.
- RSI: an overbought or oversold RSI reading alongside high ATR implies more reversal risk and calls for a wider stop.
Limitations and Common Mistakes
- No directional information: ATR can’t tell you whether price is going up or down — pair it with a directional indicator.
- Static stops in changing volatility: using the same dollar or point stop regardless of current ATR means your risk per trade isn’t consistent; recalculate stops as ATR changes.
- Comparing ATR across unrelated assets: a $5 ATR means something very different for a $20 stock than a $500 stock — compare an asset’s ATR to its own history, or use ATR% to normalize across price levels.
FAQs
What does ATR tell you about a stock or market?
ATR tells you how much volatility to expect under normal conditions. A high ATR means the asset typically moves in large ranges; a low ATR suggests smaller, more predictable movements — useful for setting appropriate stops and position sizes.
How do you use ATR for stop losses?
Multiply the current ATR by a chosen factor (commonly 1.5-3.0) and subtract it from the entry price for a long position, or add it for a short. This produces a volatility-adjusted stop that’s less likely to be hit by normal noise while still limiting risk on a real adverse move.
What is a good ATR value?
There’s no universal “good” ATR value — it depends on the asset and timeframe. Compare current ATR to the asset’s own historical average: notably below average suggests low volatility (a potential breakout setup); notably above average suggests high volatility (requiring wider stops).
Can ATR predict price direction?
No. ATR is non-directional and measures only volatility magnitude. Use it alongside a directional tool such as moving averages, trendlines, or a momentum oscillator.
What’s the difference between ATR and standard deviation?
Both measure volatility, but ATR uses the True Range, which captures gaps and limit moves, while standard deviation measures dispersion around an average price. ATR is generally more practical for setting stops and sizing positions in day-to-day trading.
Conclusion
ATR is a practical, non-directional volatility measure that adapts stop distances and position sizes to current market conditions instead of relying on a fixed number. Its value comes from comparing current readings to an asset’s own recent history and building risk management around that — not from trying to use it to predict where price is headed next.