MFI (Money Flow Index)
Updated Aug 26, 2026
- Display Type
- Oscillator
- Complexity
- Beginner to Intermediate
- Best For
- Volume-Price Analysis, Money Flow Analysis, Divergence Detection, Institutional Activity Detection
On this page
The Money Flow Index (MFI) is a volume-weighted momentum oscillator, often described as a volume-adjusted version of RSI. Developed by Gene Quong and Avrum Soudack, it applies RSI’s formula to price movement weighted by trading volume, so it reflects buying and selling pressure rather than price alone. This guide covers the formula, how to read MFI levels and divergence, practical strategies, and where volume data limits its reliability.
What Does MFI Measure?
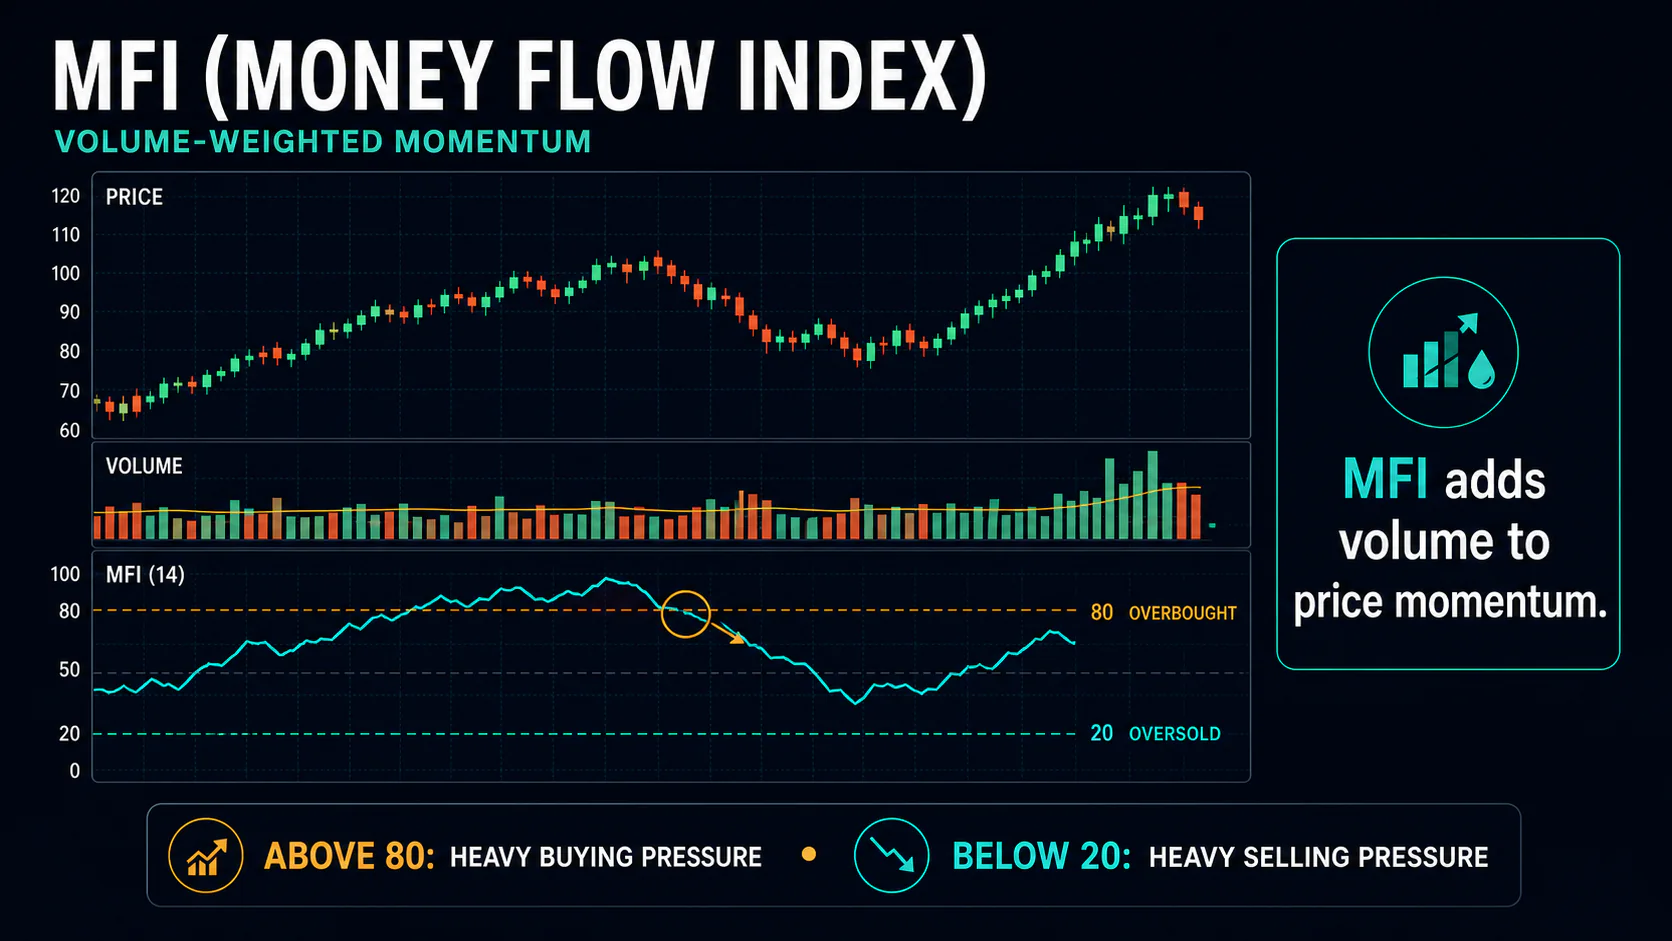
MFI ranges from 0 to 100, tracking whether volume-weighted price movement — “money flow” — has been net positive or negative over the lookback period. Because it factors in volume, a price move on heavy volume registers differently than the same move on thin volume, a distinction plain price-based oscillators like RSI can’t make.
Key Uses
- Volume-price analysis: gauge whether volume supports a price move
- Divergence detection: spot potential reversals through volume-price divergence
- Overbought/oversold conditions: identify extreme buying or selling pressure
- Trend confirmation: check that a price trend has volume behind it
- Failure swing detection: spot pressure building against the current price move before it shows up in price
How MFI Is Calculated
- Typical Price = (High + Low + Close) ÷ 3
- Raw Money Flow = Typical Price × Volume
- Positive Money Flow = Raw Money Flow on periods where Typical Price rose from the prior period
- Negative Money Flow = Raw Money Flow on periods where Typical Price fell from the prior period
- Money Flow Ratio = (sum of Positive Money Flow over N periods) ÷ (sum of Negative Money Flow over N periods)
- MFI = 100 - [100 ÷ (1 + Money Flow Ratio)]
Default Parameters
- Period: 14
- Overbought: 80
- Oversold: 20
- Source: High, Low, Close, Volume
Settings by Trading Style
| Trading Style | Period | Overbought | Oversold |
|---|---|---|---|
| Scalping | 10 | 85 | 15 |
| Day trading / swing trading | 14 (standard) | 80 | 20 |
| Position trading | 20 | 85 | 15 |
Reading MFI Levels
- Above 80: overbought
- 20-80: normal trading range
- Below 20: oversold
- Above/below 50: net positive/negative money flow, usable as a simple trend filter
Accumulation and Distribution
When price is flat or declining while MFI holds up or makes higher lows, it suggests buying pressure is building underneath the surface — a pattern often described as accumulation. The mirror case — price flat or rising while MFI makes lower highs — suggests distribution, or selling pressure building into strength. Both patterns are a variation on divergence and should be read the same way: as an early signal to watch, not an immediate trade trigger.
Trading Strategies
1. Overbought/Oversold Reversal
Buy when MFI drops below 20 and then crosses back above it; sell or short when MFI rises above 80 and then crosses back below it. Look for rising volume to accompany the move as confirmation, since volume weighting is the whole point of using MFI over RSI. Place a stop beyond the recent swing high or low, and treat the opposite extreme zone or a nearby resistance/support level as the initial target.
2. Divergence Trading
Bullish divergence: price makes a lower low while MFI makes a higher low, suggesting buying pressure is building even as price falls; enter as MFI crosses back above 20. Bearish divergence: price makes a higher high while MFI makes a lower high; enter as MFI crosses back below 80.
3. Failure Swing
MFI approaches but fails to reach 20 (or 80), then breaks its prior swing high (or low) — an early sign of a shift in pressure. Enter on that break rather than waiting for the extreme zone itself.
4. Centerline Trend Filter
MFI holding above 50, with higher lows on pullbacks, fits a bullish trend; below 50 with lower highs fits a bearish one. Use pullbacks toward 50 as potential entries in the direction of that trend.
5. Multiple Timeframe Confirmation
Check MFI on a higher timeframe for the overall money-flow bias, then use a lower timeframe for entry timing — for example, a daily MFI in oversold territory with a 4-hour MFI providing the bullish crossover. Requiring agreement across timeframes filters out some of the false signals that come from trading a single reading in isolation.
Combining MFI with Other Indicators
- RSI: use RSI as the pure-price momentum read and MFI as the volume-weighted check — a divergence confirmed on both is a stronger signal than either alone.
- Moving averages: define trend direction with a longer MA and take MFI signals only within that trend.
- Support/resistance: an MFI extreme at a key support or resistance level is a higher-quality setup than the MFI reading alone.
- Volume profile: a high-volume price node combined with an MFI extreme can mark a stronger reversal zone than either tool shows on its own.
Limitations and Common Mistakes
- Volume data quality varies: MFI is most reliable on centralized markets like stocks with representative volume. In forex, volume figures are broker-reported and don’t reflect the whole market, which weakens the indicator’s core advantage.
- Extended extremes in trends: like RSI, MFI can sit above 80 or below 20 for a long stretch during a strong trend without reversing.
- Treating every extreme as a signal: wait for MFI to exit the extreme zone and look for volume/price confirmation rather than acting on the raw reading.
- Low-volume periods: thin trading distorts the money-flow calculation and produces less reliable readings; widen the period or require more confirmation in quiet markets.
- Ignoring market structure: an MFI signal taken without regard to nearby support/resistance levels is a lower-quality setup than one that lines up with a key price level.
FAQs
How is MFI different from RSI?
MFI incorporates volume into its calculation while RSI uses price alone. That makes MFI more responsive to heavy-volume moves and gives a somewhat different read on buying and selling pressure, though the two are calculated with the same underlying formula structure.
What are the best MFI settings?
The standard 14-period MFI with 80/20 levels works well for most situations. Lower-volume markets sometimes call for a longer period (20+) and more extreme levels (85/15 or 90/10) for reliable signals.
How reliable are MFI divergences?
MFI divergences are generally considered more reliable than plain price divergences because they factor in volume, but reliability still depends heavily on market conditions and confirmation criteria — wait for MFI to exit the extreme zone before acting on any divergence.
Can MFI be used in forex trading?
With caution. Forex volume data is broker-reported and varies in quality, and doesn’t represent true market-wide volume. MFI works better on centralized markets like stocks, where volume data is accurate and representative.
What’s the difference between MFI and On-Balance Volume?
MFI is a bounded oscillator (0-100) that measures money-flow intensity and provides overbought/oversold levels. OBV is an unbounded cumulative indicator that tracks the running direction of volume flow, better suited to spotting longer-term accumulation or distribution trends.
How do you identify an MFI failure swing?
Watch for MFI approaching but failing to reach an extreme level (80 or 20), then reversing and breaking its own previous swing high or low. That failure to reach the extreme, followed by a break of the prior swing point, suggests pressure building in the opposite direction to the current price move.
When should you avoid MFI signals?
Be cautious around major news events, market open/close volatility, options expiration, and futures rollover periods — all of these can distort volume in ways that make the money-flow calculation less representative of genuine buying or selling pressure.
Conclusion
MFI’s advantage over RSI is straightforward: it weighs price movement by volume, so a move backed by heavy trading counts for more than the same move on thin volume. It works best combined with a trend read and price structure, and its reliability depends on the quality of the underlying volume data — a real limitation in markets like forex where volume isn’t centrally reported.