Williams %R
Updated Aug 26, 2026
- Display Type
- Oscillator
- Complexity
- Beginner
- Best For
- Momentum Analysis, Overbought/Oversold Detection, Divergence Analysis, Short-term Timing
On this page
Williams %R is a momentum oscillator that measures where the current close sits within the recent high-low range, on an inverted scale from 0 to -100. Developed by Larry Williams in 1973, it is essentially the mirror image of the fast Stochastic %K calculation. This guide covers the formula, how to read the inverted scale, practical strategies, and where the indicator generates false signals.
What Does Williams %R Measure?
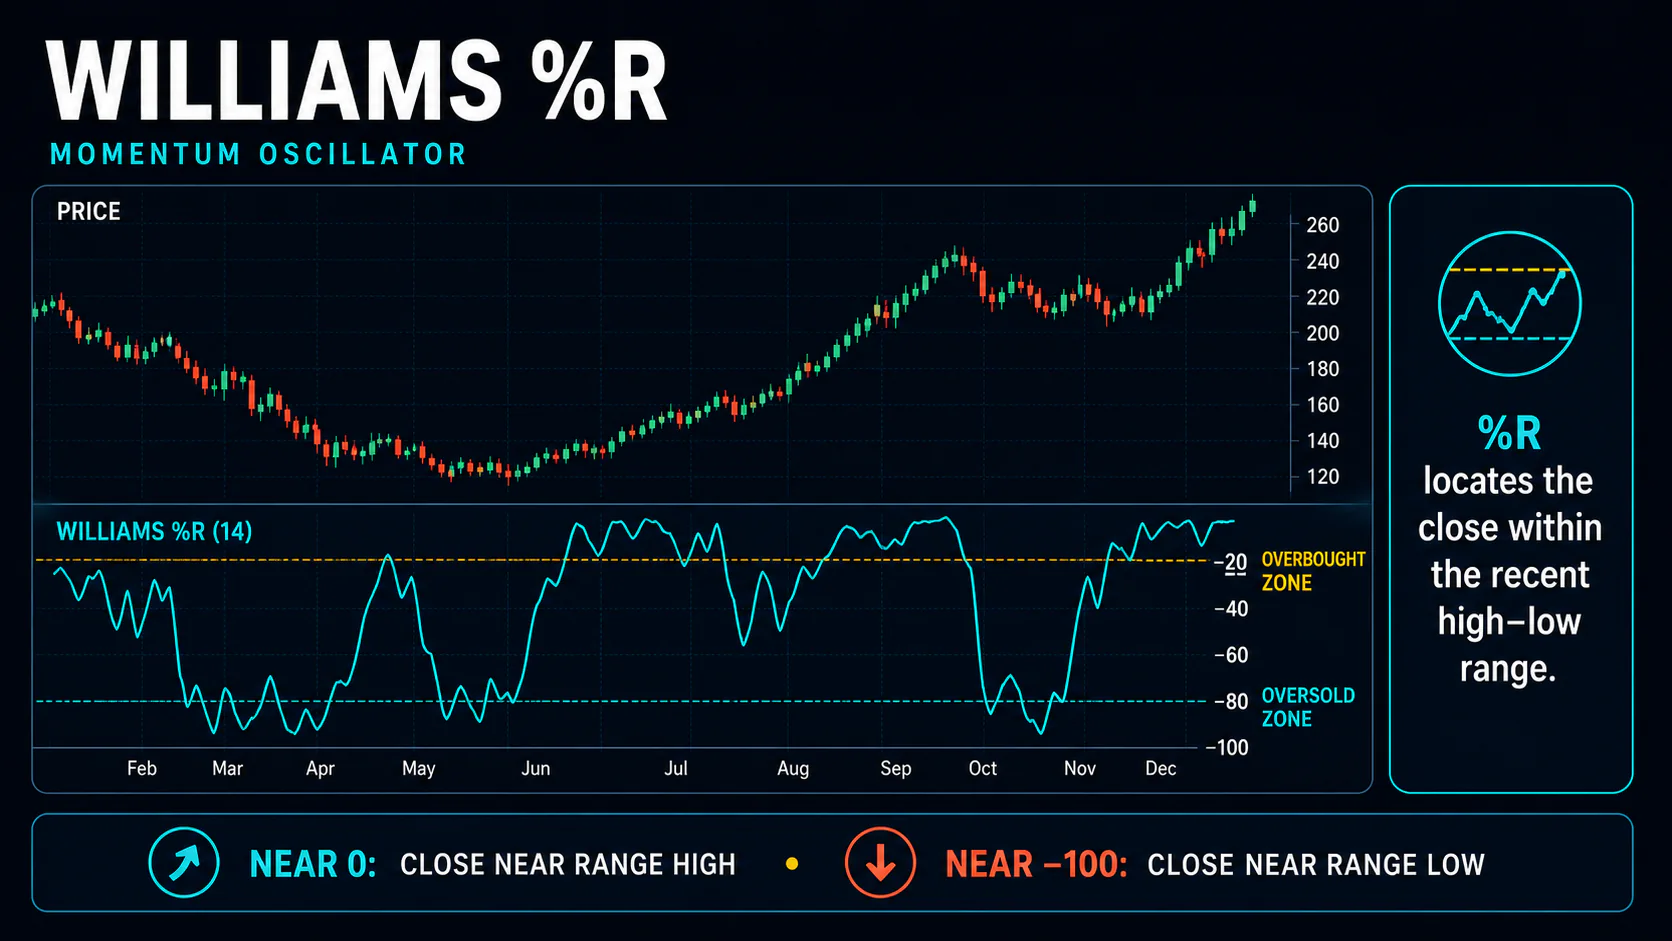
Williams %R calculates the position of the current close relative to the highest high over a lookback period (14 by default), then inverts the result into negative values. Because of the inversion, the indicator moves opposite to intuition at first glance: readings near 0 mean price is near its recent highs (overbought), and readings near -100 mean price is near its recent lows (oversold). It’s a fast-moving indicator, useful for timing short-term reversals but prone to noise in choppy markets.
Key Uses
- Overbought/oversold detection: flag when price has stretched too far in one direction
- Divergence identification: spot momentum and price moving out of sync
- Entry/exit timing: precise signals for trade initiation and exit
- Confirmation tool: validate signals generated by other indicators
How Williams %R Is Calculated
Williams %R = (Highest High - Current Close) ÷ (Highest High - Lowest Low) × -100
Where Highest High and Lowest Low are taken over the lookback period (14 by default) and Current Close is the most recent close.
Example: over 14 periods, Highest High = $52.00, Lowest Low = $48.00, Current Close = $49.00:
Williams %R = ($52.00 - $49.00) ÷ ($52.00 - $48.00) × -100 = -75
Default Parameters
- Lookback Period: 14
- Scale: 0 to -100 (inverted)
- Overbought: -20 and above
- Oversold: -80 and below
Settings by Trading Style
| Trading Style | Period | Notes |
|---|---|---|
| Scalping / day trading | 5-10 | Faster, noisier signals |
| Swing trading | 14 (standard) | Balanced sensitivity |
| Position trading | 21-28 | Smoother, fewer signals |
Stock and futures markets generally work well with the 14-period default. In forex, some traders extend to 21 periods on major pairs to account for the 24-hour trading cycle. Crypto’s higher volatility often calls for a shorter period (10 or less) for the indicator to stay responsive.
Reading the Scale
- 0 to -20: overbought — close is near the top of its recent range
- -20 to -80: neutral zone
- -80 to -100: oversold — close is near the bottom of its recent range
Because the scale is inverted, Williams %R falls as price rises, which can be confusing next to Stochastic’s non-inverted 0-100 scale even though the underlying math is nearly identical.
Oscillator Patterns
Beyond simple overbought/oversold readings, watch for a double bottom (two oversold readings while price prints a higher low) or double top (two overbought readings while price prints a lower high) as a firmer reversal signal than a single touch. A failure swing — where %R can’t reach its previous extreme before turning — can also flag fading momentum ahead of a price move.
Trading Strategies
Because Williams %R reacts quickly, entries generally work better with a confirmation step — a candlestick reversal pattern, a support/resistance level, or a second indicator — rather than acting on the raw crossover alone. Some traders also run two periods side by side (e.g., a 9-period for early warning and a 21-period for confirmation), treating agreement between the two as a stronger signal than either on its own.
1. Overbought/Oversold Reversal
Buy when %R drops below -80 and then crosses back above it; sell or short when %R rises above -20 and then crosses back below it. Place stops beyond the recent swing high/low and target the opposite zone or a nearby support/resistance level. A volume increase on the move back out of the extreme zone adds confidence, since the %R calculation itself ignores volume entirely.
2. Divergence Trading
Bullish divergence: price makes a lower low while %R makes a higher low, occurring in the oversold zone; enter as %R crosses back above -80. Bearish divergence: price makes a higher high while %R makes a lower high, occurring in the overbought zone; enter as %R crosses back below -20. A divergence with two or three touches at each extreme, ideally near a known support/resistance level, carries more weight than a single-touch divergence.
3. Trend-Following Pullback
In an established uptrend (confirmed with a moving average), wait for %R to pull back to oversold, then enter as it crosses back above -80. Mirror the approach in a downtrend using overbought pullbacks. This uses Williams %R for timing within a trend defined elsewhere, rather than trading it counter to the trend.
4. Multiple Timeframe Confirmation
Use a higher timeframe for overall bias, the trading timeframe for the signal itself, and a lower timeframe for entry confirmation — for example, a daily chart in oversold territory, an hourly %R crossing back above -80, and a 15-minute chart confirming the turn. Signals that line up across timeframes carry more weight than any single reading, though this comes at the cost of waiting for multiple conditions to align.
Combining Williams %R with Other Indicators
- RSI: both indicators reaching an extreme at the same time is a stronger signal than either alone; RSI’s smoother calculation helps filter some of Williams %R’s noise.
- Moving averages: use a longer MA for trend direction and take Williams %R signals only in that direction.
- MACD: use MACD to confirm the broader momentum direction while Williams %R times the entry.
- Bollinger Bands: a price touch at a band alongside a matching Williams %R extreme is a more convincing setup than either signal alone.
Limitations and Common Mistakes
- High sensitivity means more noise: Williams %R reacts quickly to price, which also makes it prone to false signals in choppy conditions — it needs tighter risk management than slower oscillators.
- Extended extremes in trends: like other bounded oscillators, it can sit in overbought or oversold territory for a long stretch during a strong trend rather than reversing on schedule.
- Misreading the inverted scale: because Williams %R runs 0 to -100 instead of 0 to 100, it’s easy to misread at a glance relative to Stochastic.
- Trading it in isolation: it works best as a timing tool layered onto a trend read from elsewhere, not as a standalone system.
- No exit plan: entering on an extreme reading without a predefined stop and target leaves the fast-moving nature of %R working against you rather than for you.
FAQs
How does Williams %R differ from Stochastic?
Williams %R is essentially the inverse of the Stochastic %K calculation, using a scale from 0 to -100 instead of 0 to 100. Overbought sits near 0 and oversold near -100, the reverse of where Stochastic places them.
What’s the best period setting for Williams %R?
The standard 14-period setting works well for most applications. Shorter periods (5-10) produce faster, noisier signals; longer periods (21-28) are smoother but slower to react.
Can Williams %R predict market direction?
No. It identifies momentum extremes rather than predicting direction, and is most useful for timing entries and exits around potential reversal points when combined with trend analysis.
How reliable are Williams %R divergences?
Divergences are among the stronger signals the indicator produces, particularly at key support/resistance levels and when confirmed by price action or another indicator — they should not be traded on their own.
How do you handle Williams %R in a strong trend?
Trade only in the direction of the trend: in an uptrend, use oversold pullbacks for long entries; in a downtrend, use overbought rallies for short entries. Signals against the established trend are lower-probability.
Should Williams %R be smoothed?
Applying a short simple or exponential moving average (3-5 periods) to %R can reduce whipsaws in choppy conditions, at the cost of a small delay in signals. Most traders keep the raw indicator for short-term timing and reserve smoothing for slower, position-style analysis.
What markets work best with Williams %R?
It works across any sufficiently liquid market. It’s particularly popular in forex and futures given their continuous trading hours, and performs well on stocks during active session hours when volume and volatility support fast-moving signals.
Why does Williams %R use a negative scale?
Larry Williams designed the formula around Highest High minus Close, rather than Close minus Lowest Low, which naturally inverts the result. The math is otherwise the same idea as Stochastic %K — only the sign convention differs.
Conclusion
Williams %R offers a simple, fast read on overbought and oversold conditions, with the inverted 0 to -100 scale as its main point of confusion for newcomers. Its speed is both its strength and its weakness — useful for short-term timing, but prone to false signals in choppy markets. Use it alongside a trend read from moving averages or another indicator rather than trading extreme readings in isolation.