Volume Profile
Updated Aug 26, 2026
- Display Type
- Overlay
- Complexity
- Intermediate to Advanced
- Best For
- Market Structure Analysis, Value Area Trading, Support/Resistance Identification, Institutional Activity Detection
On this page
Volume Profile is a charting tool that shows how much volume traded at each price level over a chosen period, rather than how volume moved over time. It is displayed as a horizontal histogram alongside the price axis, with longer bars marking price levels where more trading occurred. The concept grows out of Market Profile theory, developed by J. Peter Steidlmayer at the Chicago Board of Trade in the early 1980s, and treats the market as continuously searching for a fair price through the volume that accumulates at each level.
What is Volume Profile?
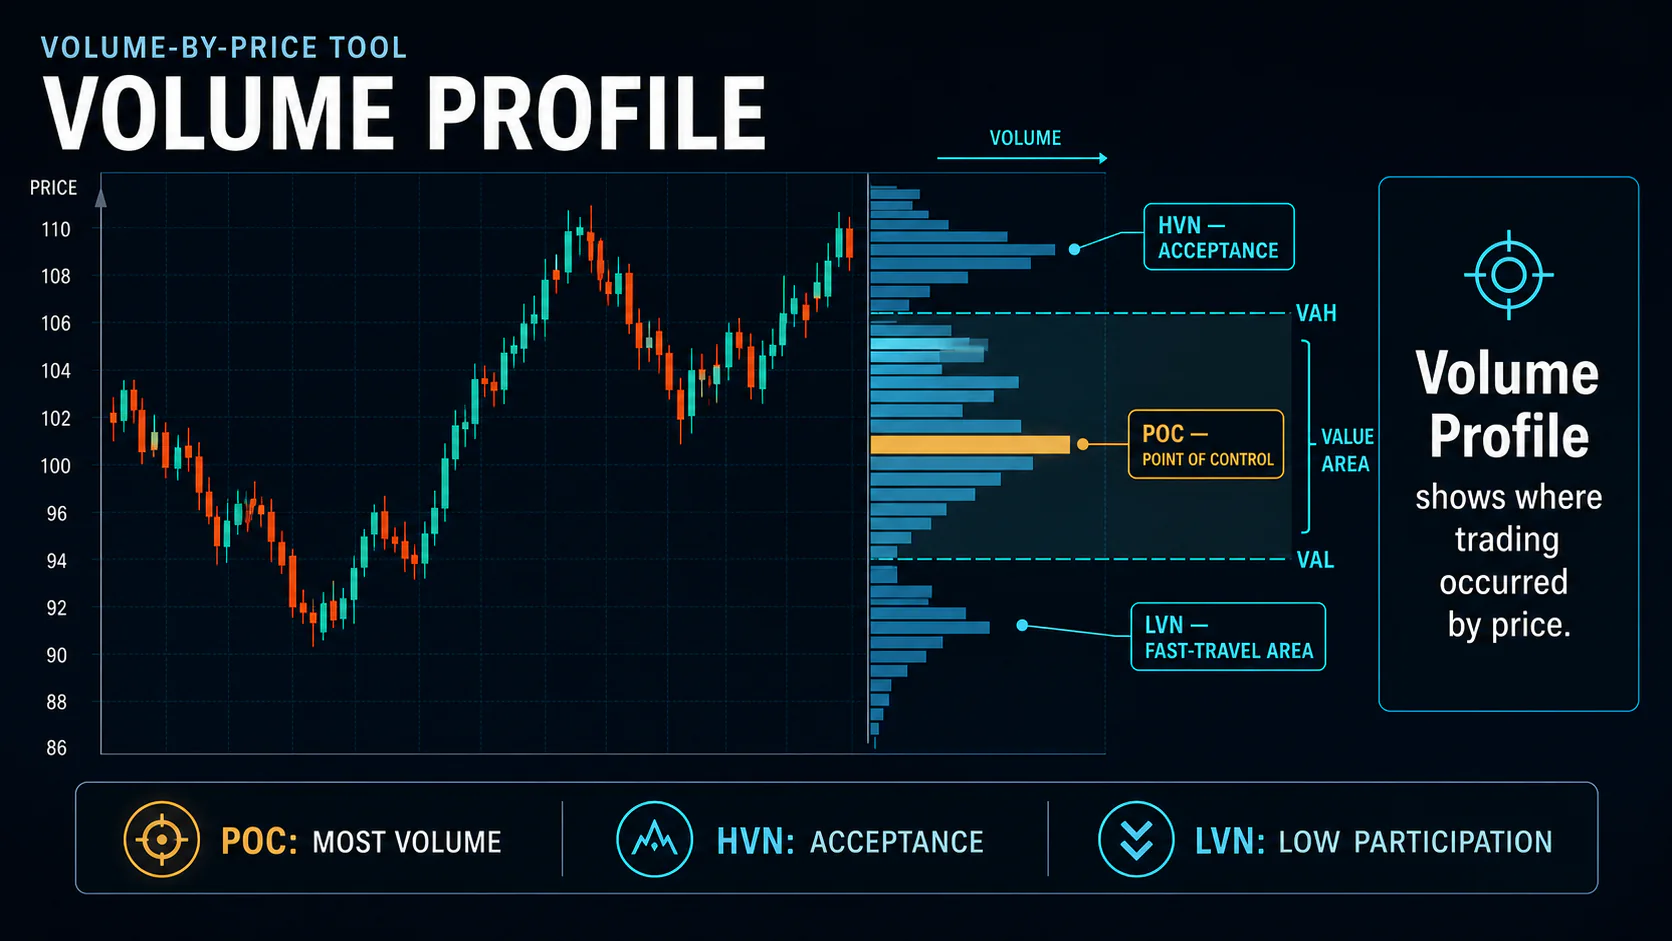
Levels with heavy volume represent prices where buyers and sellers transacted in size and effectively agreed on value; levels with thin volume represent prices the market moved through quickly without much participation. That distinction is the core of how the tool is used: high-volume areas tend to attract price back to them and offer support/resistance, while low-volume areas tend to see price move through them rapidly rather than stall.
Key Uses
- Market Structure: See where the market accepted or rejected price over the period
- Value Area Trading: Trade around the range that captured the bulk of volume
- Support/Resistance: Identify levels based on actual transaction volume rather than price patterns alone
- Institutional Activity: High-volume clusters often mark where large participants built or exited positions
Core Components
Point of Control (POC): the single price level with the highest traded volume in the period. It represents the most-accepted price and frequently acts as a strong support or resistance level afterward.
Value Area (VA): the price range containing roughly 70% of the period's total volume, bounded by the Value Area High (VAH) and Value Area Low (VAL). It approximates where the market spent most of its time transacting, and is treated as the "fair value" range for the period.
High Volume Nodes (HVN): price levels with well-above-average volume outside the POC itself; these tend to behave like the POC on a smaller scale, offering support/resistance and areas where price often returns.
Low Volume Nodes (LVN): price levels with minimal volume, representing areas the market passed through quickly. Price tends to move through an LVN rapidly rather than stall there, which makes LVNs better read as continuation zones than as reversal points.
Profile Types and Shapes
A fixed range profile covers a user-defined period (useful for analyzing a specific event or move); a visible range profile automatically recalculates for whatever is currently on screen; a session profile covers a single trading session; and a periodic profile (daily, weekly, monthly) allows comparison of volume distribution across recurring periods.
The overall shape of a profile is informative on its own. A roughly normal, bell-shaped distribution with the POC near the center suggests a balanced, two-sided market that found value efficiently. A double-peaked (bimodal) profile suggests the market spent time at two distinct price zones, often indicating a shift in sentiment partway through the period. A profile skewed heavily toward one end of its range indicates a directional, one-sided market rather than a balanced one.
Interpreting Volume Profile
Price trading above the value area is read as trading above the period's fair value, with some expectation of a pull back toward the VA; price below the value area is read the same way in reverse. Price trading inside the value area suggests a balanced, range-bound market, with the VAH and VAL functioning as the range's boundaries and the POC as a central reference point.
Trading Strategies
POC Reactions
Because the POC is the period's most heavily traded price, reactions there — a bounce or a rejection — are often more significant than reactions at less-traded levels. A decisive break through the POC with strong volume, followed by a retest of the POC from the other side, is commonly used as a trend-continuation entry.
Value Area Trading
In balanced, range-bound conditions, buying near VAL and selling near VAH — using the POC as a bias reference — is a straightforward way to trade the value area as a range. A break beyond VAH or VAL on strong volume is instead treated as a potential breakout from that range, with the broken boundary becoming the new support or resistance.
Low Volume Node Continuation
Because LVNs see little participation, price crossing one tends to keep moving rather than stall — traders use LVN breaks as continuation signals and target the next HVN or POC as a likely area for the move to slow down, rather than trying to pick a reversal inside the gap itself.
Combining Volume Profile with Other Indicators
Candlestick reversal patterns at the POC or value area boundaries add timing precision that the profile itself doesn't provide. A longer-term moving average gives trend context, so value-area signals are weighted toward the direction of the broader trend. Pivot points are calculated differently but sometimes coincide with volume-based levels, and confluence between the two — a pivot level landing near the POC, for example — is generally read as a stronger level than either alone. OBV can help confirm whether volume flow supports a breakout beyond the value area rather than a false move.
Market Conditions
In trending markets, the profile skews toward the trend direction, the POC tends to sit near one extreme rather than the center, and low-volume gaps mark where the trend accelerated — favoring continuation strategies over mean reversion. In range-bound markets, the profile is more balanced and symmetric, the POC sits near the center, and value-area boundary trading tends to work well. In highly volatile or choppy conditions, volume can scatter across many price levels without a clear POC forming, which makes the profile less useful until conditions settle — in that case, weighting a longer-period (weekly or monthly) profile over the most recent session can help.
Common Mistakes
- Ignoring the time period behind a profile: match the profile period (session, daily, weekly) to your trading timeframe.
- Relying on a single timeframe profile: checking a higher-timeframe profile alongside the trading-timeframe one gives more complete context.
- Treating LVNs as support/resistance: they are continuation zones precisely because little volume transacted there — don't expect price to react at an LVN the way it would at an HVN.
- Using unreliable volume data: forex volume profiles are built on tick counts as a proxy for real volume and should be trusted less than profiles built on actual exchange volume (stocks, futures).
FAQs
How is Volume Profile different from a regular volume indicator?
A standard volume indicator shows volume over time (how much traded on each bar); Volume Profile shows volume by price (how much traded at each price level), which reveals where the market found value rather than when.
What makes a Volume Profile level significant?
The percentage of total period volume concentrated at that level. The POC (the single highest-volume price) is the most significant, followed by the value area boundaries and other high-volume nodes.
How do you choose the right period for a profile?
Match it to your trading timeframe and goal — session profiles for day trading, daily or weekly profiles for swing trading, and weekly or monthly profiles for position-level context.
Can Volume Profile predict future price moves?
No — it describes where past volume occurred, which provides probable support/resistance levels, not a forecast. Price frequently revisits high-volume areas, but that's a tendency, not a guarantee.
How reliable is Volume Profile across different markets?
It's most reliable where real, centralized volume data exists — stocks and futures. Forex profiles rely on tick-volume proxies and are correspondingly less reliable.
How should gaps be handled in Volume Profile analysis?
A gap typically shows up as a low volume node, which behaves as a continuation zone — price tends to move through it quickly rather than finding support or resistance there.
Conclusion
Volume Profile turns raw trading volume into a map of where the market actually agreed on price, rather than just when trading occurred. The point of control and value area give traders concrete, volume-derived levels that complement price-pattern-based support and resistance, while high- and low-volume nodes help distinguish likely reaction zones from likely continuation zones. Its main limitation is data quality — it's only as good as the volume feed behind it — and, like any level-based tool, it describes probable reactions rather than certainties, so it works best combined with price action and a read on the broader trend.