OBV (On Balance Volume)
Updated Aug 26, 2026
- Display Type
- Oscillator
- Complexity
- Beginner to Intermediate
- Best For
- Volume Analysis, Trend Confirmation, Divergence Detection, Accumulation/Distribution Analysis
On this page
On Balance Volume (OBV) is a cumulative momentum indicator that adds a period's volume when price closes higher and subtracts it when price closes lower. Developed by Joe Granville in the 1960s, OBV is built on the idea that volume often shifts before price does. The resulting line has no meaningful absolute value — only its trend and its relationship to price matter, particularly when the two diverge.
What is OBV?
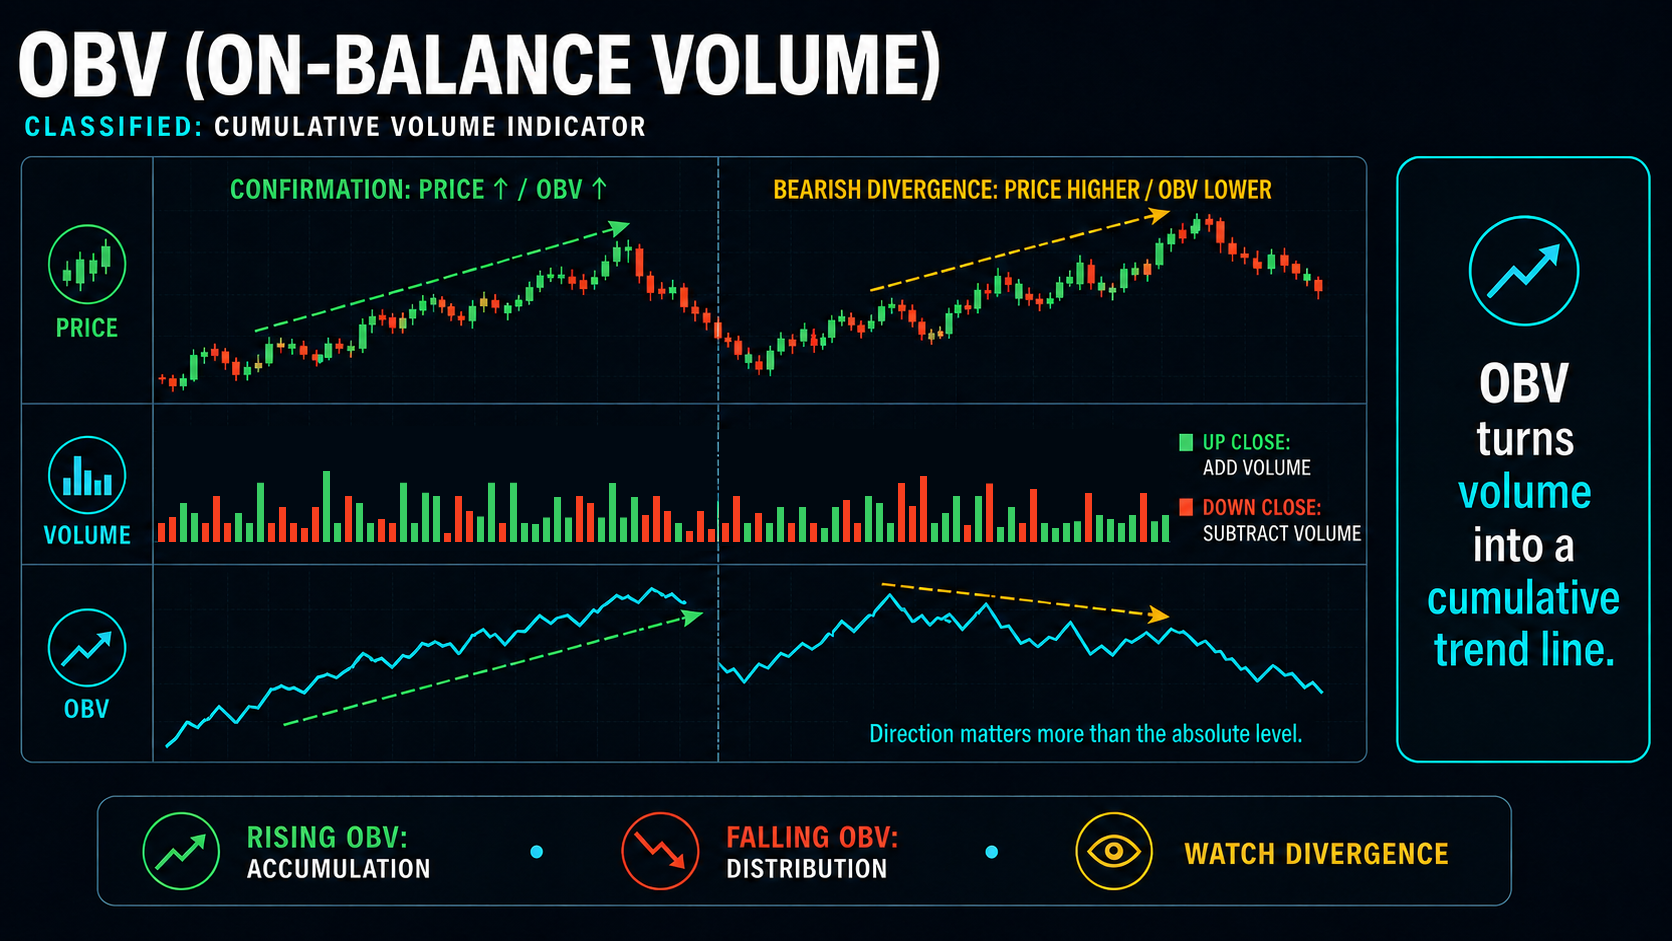
OBV creates a running total that reflects whether volume is flowing into or out of a security. When a security closes higher than the previous close, that day's entire volume is added to the OBV total; when it closes lower, that volume is subtracted; an unchanged close leaves OBV unchanged. Because it is cumulative and unbounded, the absolute level of OBV is arbitrary and depends on where the calculation started — what matters is the slope of the line, its highs and lows relative to prior highs and lows, and how it compares to price action over the same period.
When OBV and price move in the same direction, that is read as confirmation that volume supports the trend. When they move in opposite directions, that divergence may warn of a weakening trend — though divergences can persist for a long time before resolving, or fail to resolve at all, so they work better as a warning to tighten risk management than as a standalone signal to reverse a position.
Key Uses
- Trend Confirmation: Check whether volume is supporting the current price trend
- Divergence Detection: Spot situations where volume and price disagree, often ahead of a stall in price
- Breakout Confirmation: Verify that a price breakout is backed by genuine volume participation
- Accumulation/Distribution Reading: Gauge whether net volume pressure is building or fading over time
How OBV Works
Formula
- If Close > Previous Close: OBV = Previous OBV + Volume
- If Close < Previous Close: OBV = Previous OBV − Volume
- If Close = Previous Close: OBV = Previous OBV (unchanged)
The first period's OBV is typically set to that period's volume (or to zero), and every subsequent value builds cumulatively on it. OBV has no adjustable parameters — the calculation is fixed, and the only real choice is which chart timeframe to apply it to and whether to smooth it with a moving average.
Reading the Line
- Rising OBV: Net volume pressure is to the buy side (accumulation)
- Falling OBV: Net volume pressure is to the sell side (distribution)
- Flat OBV: Up-volume and down-volume are roughly in balance
Interpreting Signals
| Pattern | Description | Typical Use |
|---|---|---|
| Confirmation | Price and OBV trend in the same direction | Trend following |
| Bullish divergence | Price makes a lower low, OBV makes a higher low | Watch for reversal, wait for price to confirm |
| Bearish divergence | Price makes a higher high, OBV makes a lower high | Watch for reversal, wait for price to confirm |
| Breakout | OBV clears a prior swing high/low alongside price | Momentum / breakout confirmation |
A reliable divergence generally needs at least two clearly divergent swing points spanning several periods — an isolated wiggle in OBV against price isn't enough to act on by itself. OBV tends to be cleaner on daily and weekly charts than intraday, where volume is noisier and requires more filtering.
Trading Strategies
Trend Confirmation
Use OBV to validate that a trend has volume behind it. If price is making higher highs and higher lows and OBV is doing the same, treat pullbacks within the trend as continuation opportunities rather than reversal warnings — and the reverse in a downtrend. If OBV stalls or turns down while price keeps making new highs, treat the trend as suspect and tighten stops or reduce exposure. A practical stop is placed beyond the most recent price swing point, not at an OBV level, since OBV has no fixed price scale.
Divergence Trading
When price and OBV diverge, wait for price itself to show a reversal signal — a support bounce, a candlestick reversal pattern, or a broken trendline — before acting. Trading the divergence alone, before price confirms it, is a common source of premature entries, since divergences can keep extending for many periods without price ever turning.
Breakout Confirmation
A price breakout accompanied by OBV breaking its own prior high or low, on above-average volume, is more likely to hold than one where OBV lags or fails to confirm. Weak or flat OBV during a price breakout is a warning sign of a possible false move, and traders often use it as a filter to skip low-conviction breakouts rather than as a trade trigger on its own.
Combining OBV with Other Indicators
Moving averages: use a longer-term average (such as the 50- or 200-day) to establish the dominant trend, then only act on OBV signals that agree with that direction — this filters out counter-trend noise in choppy markets.
RSI or MACD: OBV measures volume-based momentum while RSI and MACD measure price-based momentum. A signal that shows up in both — for example, OBV turning up while RSI comes off an oversold reading, or OBV rising alongside a bullish MACD crossover — carries more weight than either indicator alone. Divergences that appear on both OBV and a price oscillator at the same time are the more notable case.
Price action: candlestick patterns and support/resistance levels provide the entry timing that OBV, as a lagging cumulative series, cannot. Use OBV for directional bias and confirmation, and price action for the actual trigger.
Limitations and Common Mistakes
- Trading OBV without price confirmation: OBV alone doesn't generate a complete trade signal — always wait for price to confirm before acting.
- Treating OBV as a standalone system: it works best combined with price action and at least one other indicator.
- Over-reading minor wiggles: require clear, multi-point divergences spanning several periods rather than single-bar noise.
- Ignoring market context: OBV is most useful in trending markets and considerably less reliable in choppy, range-bound conditions where volume swings both ways without commitment.
- Assuming flat OBV means nothing is happening: extended balance between buying and selling volume can precede a breakout in either direction.
- Forgetting volume-data quality varies by market: forex and many futures markets lack centralized volume, so OBV there is built from tick counts or broker-reported volume — a weaker proxy than true exchange volume for stocks.
FAQs
How is OBV different from other volume indicators?
OBV is cumulative and reflects all of a period's volume based on the direction of the close, while indicators like Volume Rate of Change measure period-to-period changes in volume itself. OBV's cumulative nature makes it better suited to longer-term trend and divergence analysis.
Can OBV be used for intraday trading?
Yes, but intraday OBV is noisier and benefits from confirmation by price action or another indicator. It is generally more reliable on daily and weekly charts, where a full session's volume is captured in each bar.
What makes a good OBV divergence?
Look for at least two clearly divergent swing points spanning multiple periods, with price and OBV moving in opposite directions, ideally alongside a separate technical signal such as a support or resistance reaction.
Does OBV work in all market conditions?
It performs best in trending markets with consistent volume. In ranging or highly volatile markets it generates more false signals and needs additional confirmation before being acted on.
How do you set stop losses with OBV signals?
Use price-based stops — beyond a recent swing point, a support/resistance level, or an ATR multiple — rather than OBV levels themselves. OBV informs directional bias, not stop placement.
Can OBV predict exact turning points?
No. It can flag that volume and price disagree, which sometimes precedes a reversal, but it doesn't provide timing. Precise entries and exits still come from price action.
Conclusion
On Balance Volume is a simple, parameter-free way to track whether volume is confirming or contradicting a price trend. Its value comes from comparing its slope and swing points to price over time, not from any single reading in isolation — the absolute level of the line means nothing on its own. Used alongside price action and at least one other indicator, and with realistic expectations about how long divergences can run before they resolve, OBV remains one of the more durable and widely used volume-based tools in technical analysis.