RSI (Relative Strength Index)
Updated Aug 26, 2026
- Display Type
- Oscillator
- Complexity
- Beginner
- Best For
- Overbought/Oversold Analysis, Divergence Detection, Momentum Analysis, Entry/Exit Signals
On this page
RSI (Relative Strength Index) is a bounded momentum oscillator that measures the speed and magnitude of recent price changes to flag overbought and oversold conditions. Developed by J. Welles Wilder Jr. in 1978, it moves between 0 and 100, with readings above 70 traditionally read as overbought and below 30 as oversold. This guide covers how RSI is calculated, how to read its levels and divergence signals, practical trading approaches, and where the indicator commonly misleads traders.
What Does RSI Measure?
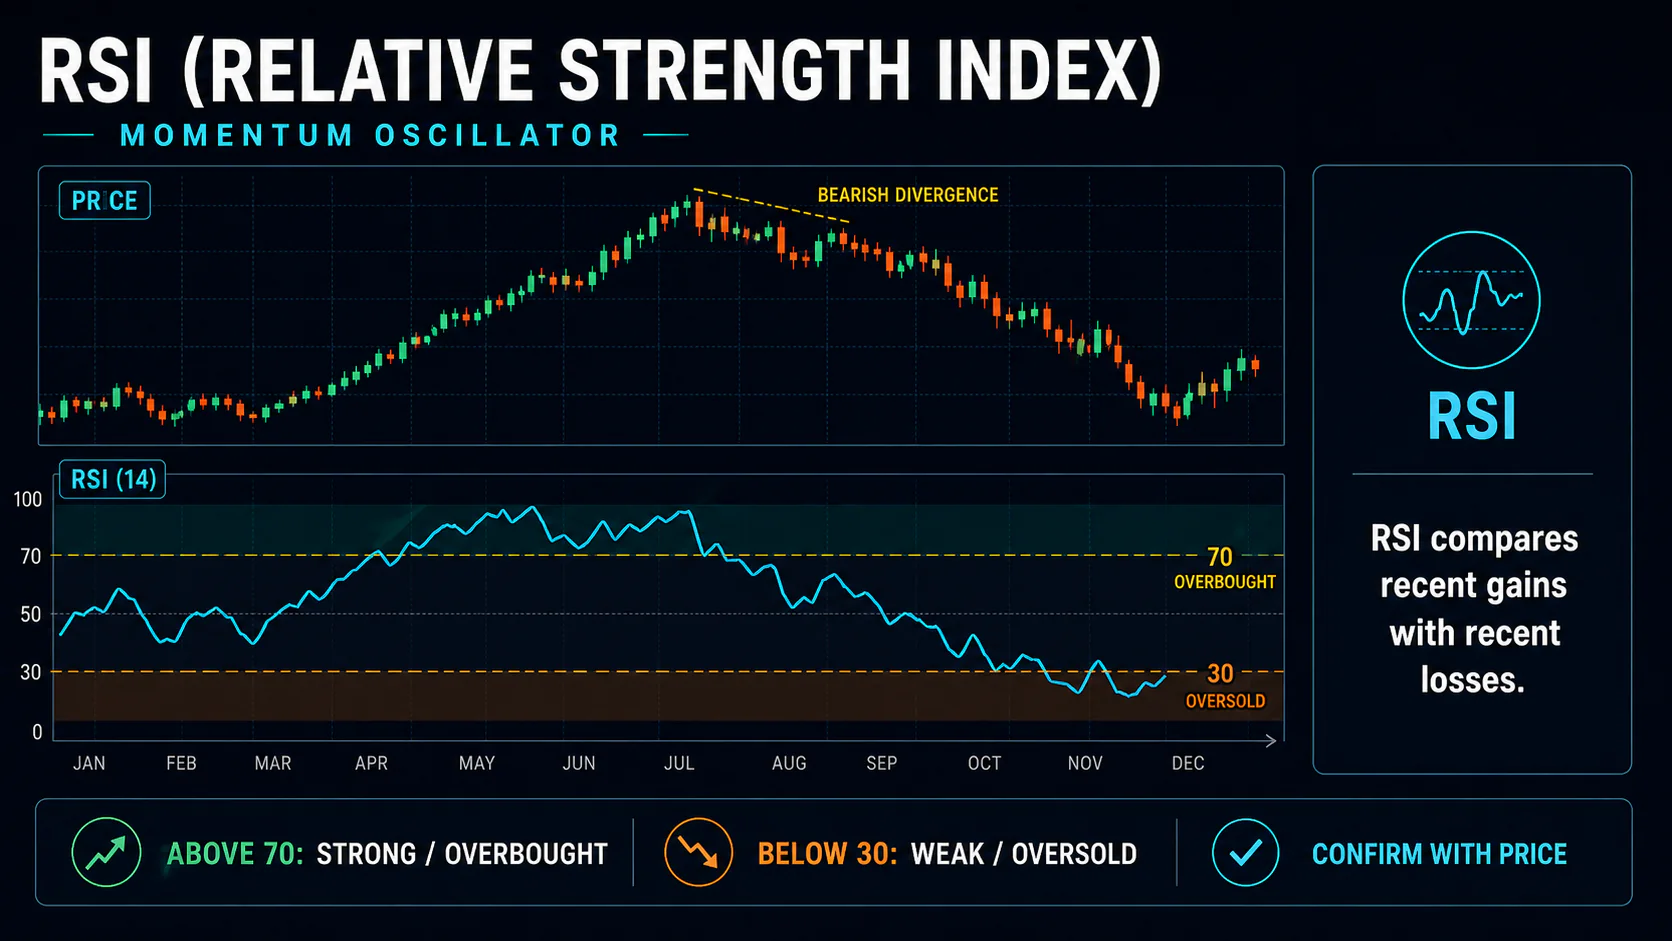
RSI compares the size of a security’s recent gains to its recent losses over a set lookback period (14 by default) to gauge whether upward or downward momentum currently dominates. Because it is bounded between 0 and 100, RSI is easy to read at a glance and behaves consistently across markets and timeframes, unlike unbounded indicators such as MACD.
Key Uses
- Overbought/oversold identification: spot momentum extremes
- Divergence detection: flag potential reversals before price confirms them
- Momentum measurement: gauge the strength of a price move
- Entry/exit timing: generate signals for trade execution
How RSI Is Calculated
The first RSI value uses a simple average over the lookback period:
- Average Gain = sum of gains over 14 periods ÷ 14
- Average Loss = sum of losses over 14 periods ÷ 14
Every value after that uses Wilder’s smoothing method, which folds in the prior average rather than recalculating from scratch:
- Average Gain = [(Previous Average Gain × 13) + Current Gain] ÷ 14
- Average Loss = [(Previous Average Loss × 13) + Current Loss] ÷ 14
From there:
- RS (Relative Strength) = Average Gain ÷ Average Loss
- RSI = 100 - (100 ÷ (1 + RS))
Default Parameters
- Period: 14
- Overbought: 70 (80 in a stricter variant used on volatile assets)
- Oversold: 30 (20 in the stricter variant)
- Source: Close price
Reading RSI Levels
- Above 70: overbought — upward momentum is stretched
- 30-70: normal trading range
- Below 30: oversold — downward momentum is stretched
- Above/below 50: bullish/bearish momentum bias, often used as a simple trend filter
Some traders substitute 80/20 for 70/30 on volatile assets or in strongly trending markets, since the standard levels can trigger too few signals when momentum is running hot in one direction.
Signal Types
- Oversold bounce: RSI drops below 30, then crosses back above it
- Overbought reversal: RSI rises above 70, then crosses back below it
- Centerline cross: RSI crossing the 50 line signals a momentum shift
- Divergence: RSI and price move in opposite directions
Regular vs. Hidden Divergence
Regular divergence warns of a potential reversal: price makes a lower low while RSI makes a higher low (bullish), or price makes a higher high while RSI makes a lower high (bearish). Hidden divergence instead signals trend continuation: price makes a higher low while RSI makes a lower low (bullish continuation), or price makes a lower high while RSI makes a higher high (bearish continuation).
RSI Settings by Trading Style
| Trading Style | Period | Overbought | Oversold |
|---|---|---|---|
| Scalping | 9 | 80 | 20 |
| Day trading / swing trading | 14 (standard) | 70 | 30 |
| Position trading | 21 | 75 | 25 |
Trading Strategies
1. Overbought/Oversold Reversal
Buy when RSI drops below 30 and then crosses back above it; sell or short when RSI rises above 70 and then crosses back below it. Place stops beyond the recent swing high or low and target the opposite RSI extreme or a nearby support/resistance level. This works best in range-bound markets — in a strong trend, RSI can stay pinned in overbought or oversold territory for a long stretch, so treat reversal signals against a clear trend as lower-probability trades.
2. Divergence Trading
Watch for divergence between price and RSI at swing highs and lows. Wait for RSI to exit the extreme zone (crossing back above 30 for bullish divergence, below 70 for bearish) before entering, and confirm with price action or a support/resistance level rather than acting on the divergence alone.
3. Trend Filter (50 Centerline)
Use the 50 line as a simple trend filter: only take long RSI signals when RSI is above 50, and only take short signals when it is below 50. Combine with a longer moving average for a second trend check before entering.
4. Multiple Timeframe Confirmation
Check RSI on a higher timeframe for the overall momentum bias, then use the trading timeframe for entry timing — for example, a daily RSI holding above 50 combined with a 4-hour RSI bouncing off 30. Requiring agreement across timeframes produces fewer signals but filters out some of the noise from trading a single reading in isolation.
Combining RSI with Other Indicators
- Moving averages: use a 50-period EMA to define trend direction and trade RSI signals only in that direction.
- MACD: RSI flags overbought/oversold extremes; MACD confirms whether underlying momentum actually supports a reversal.
- Support/resistance: an RSI extreme that lines up with a key price level is a higher-quality setup than either signal alone.
- Volume: a reversal off an RSI extreme backed by rising volume is more convincing than the same signal on thin trading.
Limitations and Common Mistakes
- Overbought does not mean “sell now”: in a strong trend, RSI can stay above 70 (or below 30) for an extended period while price keeps moving. Treating every extreme reading as an automatic reversal signal is one of the most common RSI mistakes.
- Ignoring trend context: counter-trend RSI signals perform far worse in strongly trending markets than in range-bound ones. In a strong trend, some traders shift to 80/20 levels or rely on the 50 line instead of 70/30.
- Acting on divergence too early: a divergence can keep building across several swings before price actually reverses — wait for RSI to exit the extreme zone before entering.
- Mismatched period and timeframe: a 9-period RSI on a daily chart is noisy; a 21-period RSI on a 5-minute chart lags badly. Match the period to your holding time.
FAQs
What is a good RSI setting?
The standard 14-period RSI with 70/30 levels works well for most situations. Shorter periods (9) react faster but generate more noise; longer periods (21) are smoother but slower to signal. Volatile assets sometimes call for 80/20 instead of 70/30.
How do you trade RSI divergence?
Identify where price and RSI are moving in opposite directions at swing highs or lows, then wait for RSI to exit the extreme zone before entering. Confirm with support/resistance levels or a candlestick pattern rather than trading the divergence alone.
Can RSI stay overbought or oversold for a long time?
Yes, especially in strong trends. RSI can remain above 70 or below 30 for an extended stretch while a powerful trend continues, which is why trend context matters when interpreting RSI signals.
What’s the difference between RSI and Stochastic?
Stochastic measures where price sits within its recent high-low range, while RSI measures the ratio of average gains to average losses. RSI is generally smoother; Stochastic is more sensitive and generates more frequent signals.
When should you avoid RSI signals?
Be cautious trading RSI extremes during strong trending markets without additional context, around major news events, and in thin, low-volume conditions where readings can whipsaw.
How do you identify RSI support and resistance?
RSI can form its own recurring reversal levels, separate from the standard 70/30 zones — for example, oscillating between 40 and 60 during a period of consolidation. Watch for repeated bounces or breaks at these levels the same way you would on a price chart, and treat a break of an established RSI range as a signal that momentum conditions are shifting.
Conclusion
RSI remains one of the most accessible momentum indicators because its bounded 0-100 range and clear overbought/oversold levels are easy to read at a glance. It works best in range-bound markets for mean-reversion trades and as a divergence tool for spotting early warning signs of a reversal — but it requires trend context to avoid the classic mistake of fading every overbought or oversold reading in a market that is simply trending hard. Use it alongside a trend read from moving averages or price structure, not as a standalone system.