Advance-Decline Line (A/D Line)
Updated Sep 2, 2026 · Reviewed by Terence Scott, founder
- Display Type
- Breadth Indicator (cumulative line)
- Complexity
- Beginner to Intermediate
- Best For
- Market Breadth, Divergence Detection, Rally Health, Index Confirmation
On this page
The advance-decline line — the A/D line — is the classic measure of market breadth. Each session it takes the number of advancing stocks minus the number of declining stocks and adds that net figure to a running total. The result is a single line that answers a question a capitalization-weighted index cannot: is the market actually rising, or are a few giant stocks rising while everything else quietly falls?
What is the A/D Line?
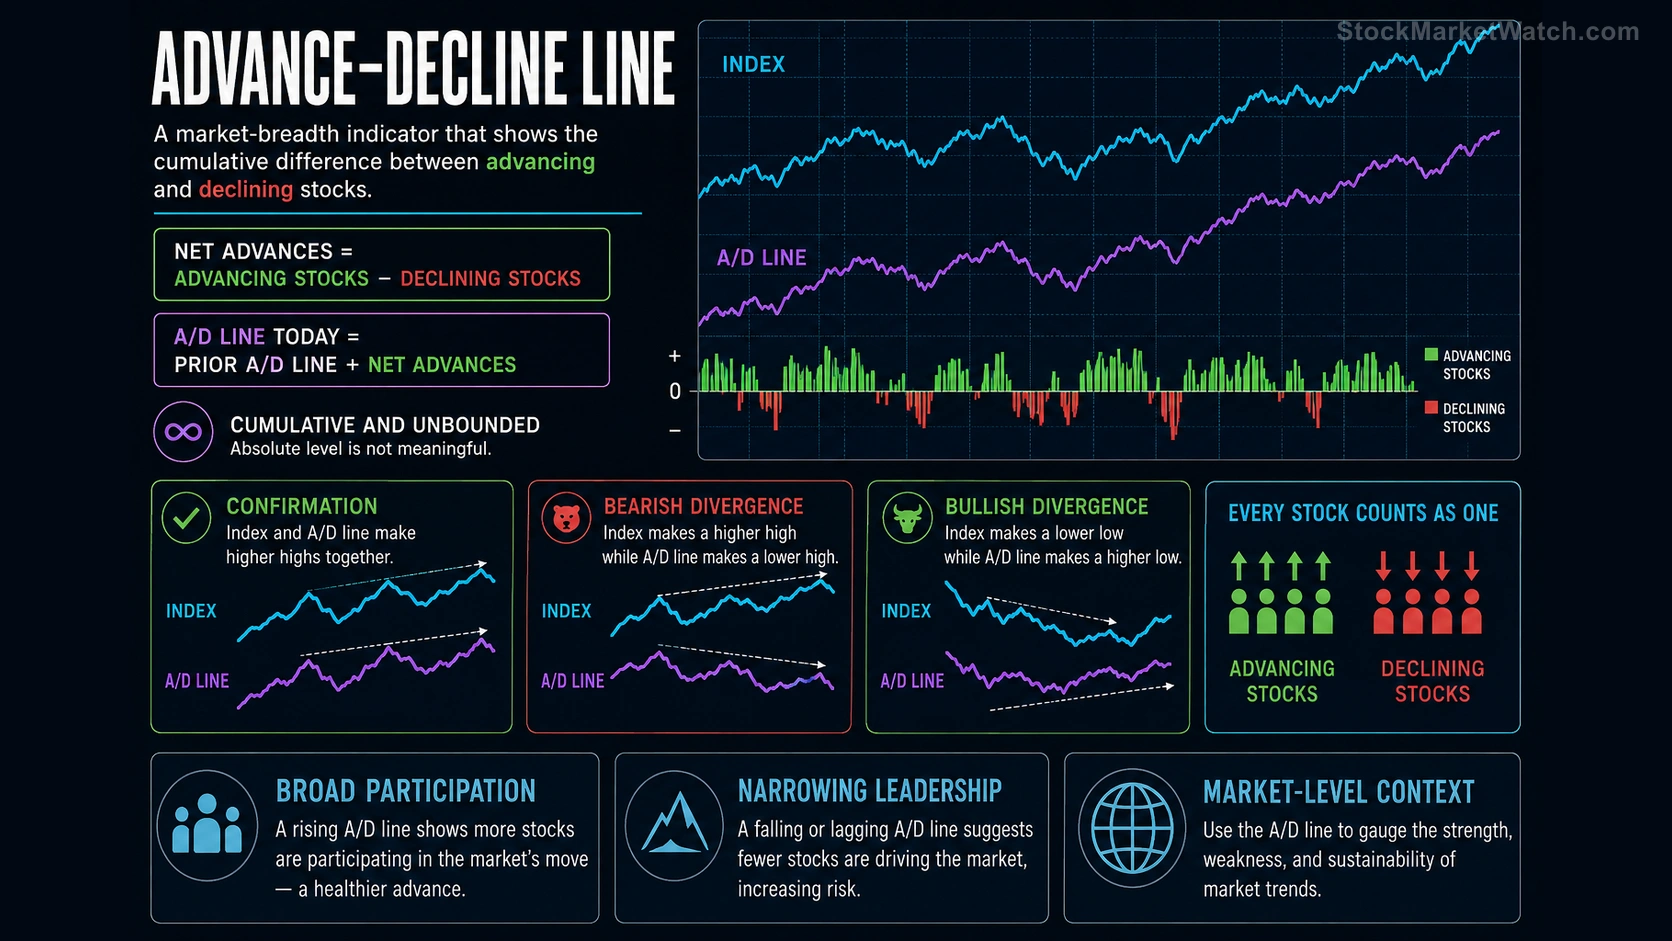
Major indexes are weighted by size, so a handful of mega-cap names can carry an index higher while most of its members decline. The A/D line strips out size entirely — every stock counts as one vote, advance or decline. When the index and the A/D line rise together, the rally is broad and healthy. When the index makes new highs that the A/D line refuses to confirm, leadership is narrowing: fewer and fewer stocks are doing the work, which is how major tops have historically been constructed.
How It's Calculated
A/D line today = A/D line yesterday + (advancing issues − declining issues)
Like OBV, the line is cumulative and unbounded, so its absolute value is meaningless — it depends entirely on when the calculation started. Everything that matters is in the slope, the pattern of highs and lows, and the comparison against the index over the same window. The NYSE A/D line is the traditional benchmark; the same arithmetic works on the Nasdaq, the S&P 500's members, or any defined universe.
Interpreting Signals
- Confirmation: index at new highs + A/D line at new highs = broad participation. The trend has soldiers, not just generals.
- Bearish divergence: index makes a new high, the A/D line makes a lower high. The average stock has already stopped advancing; the index is being held up by narrowing leadership. This is the A/D line's signature warning, and it can lead price by weeks or months — famously appearing well before major historical tops.
- Bullish divergence: index makes a new low while the A/D line holds a higher low — the average stock has stopped going down, and selling is concentrating in fewer names.
- Slope changes: a flattening A/D line during an advance is an early caution flag even before any divergence completes.
Trading With the A/D Line
The A/D line is a market-level instrument, not a per-stock signal — its job is to set the backdrop against which individual setups are taken:
- Regime filter: breakouts and momentum entries carry better odds when breadth confirms the index; a narrowing market punishes late entries in extended leaders.
- Top awareness: a multi-week bearish divergence argues for tightening stops, taking partial profits, and treating fresh index highs with suspicion rather than celebration.
- Bottom spotting: after a decline, improving breadth while the index retests lows is one of the more reliable early signs of repair.
Our Market Pulse dashboard tracks live market breadth alongside the indexes, and the signal scans show which individual names are driving each day's advance and decline counts.
Combining With Other Indicators
- % of stocks above key moving averages — a bounded breadth cousin that answers "how many stocks are in uptrends" while the A/D line answers "which way is the average stock moving today"; together they cover level and flow.
- MFI / OBV on the index — volume-based confirmation of what breadth is suggesting.
- Moving averages on the A/D line itself — some traders smooth the line to filter daily noise and watch for crossovers as regime shifts.
Limitations and Common Mistakes
- Listing composition skews the NYSE version. The NYSE includes closed-end bond funds, preferred shares and other rate-sensitive issues, so its A/D line partly reflects interest-rate conditions rather than pure equity appetite. Breadth on the S&P 500 members or common-stock-only universes avoids this.
- The absolute level means nothing. Comparing today's A/D value to a level from years ago is a category error — only shape and relative behavior matter.
- Divergences are early, not precise. Breadth can deteriorate for months while a narrow rally continues; the A/D line grades the rally's health, it does not time its end.
- One day tells you nothing. A single strong-breadth session inside a downtrend is routine; the signal lives in trends and divergences, not daily prints.
FAQs
What's the difference between the A/D line and the advance-decline ratio? The ratio (advances ÷ declines) is a same-day snapshot that oscillates; the line is cumulative and reveals multi-week trends and divergences. The line is the strategic tool, the ratio a tactical one.
Which index's A/D line should I watch? The NYSE line is the classic; a common-stock or S&P 500-member version gives a cleaner read on equities specifically. Watching one consistently matters more than which one.
Can it be used on individual stocks? No — it is built from counts of many stocks. The closest single-stock analogs are volume-flow tools like OBV and MFI.
Conclusion
The A/D line is the market's honesty check: it counts every stock equally and reports whether the advance the index is showing you is real, broad, and shared — or narrow, tired, and rented from a few large names. It won't time entries, but as a backdrop for every other signal on this site, few indicators earn their place on a chart more cheaply.