Pivot Points
Updated Aug 26, 2026
- Display Type
- Overlay
- Complexity
- Beginner to Intermediate
- Best For
- Support/Resistance Analysis, Day Trading, Entry/Exit Points, Price Target Setting
On this page
Pivot points are support and resistance levels calculated from the previous period's high, low, and close. Originally used by floor traders, they are fixed for the entire session rather than moving with price, which makes them a simple way to set reference levels before the market opens. Several calculation variants exist, but all share the same basic idea: derive a central price and a set of levels above and below it from the prior period's range.
What are Pivot Points?
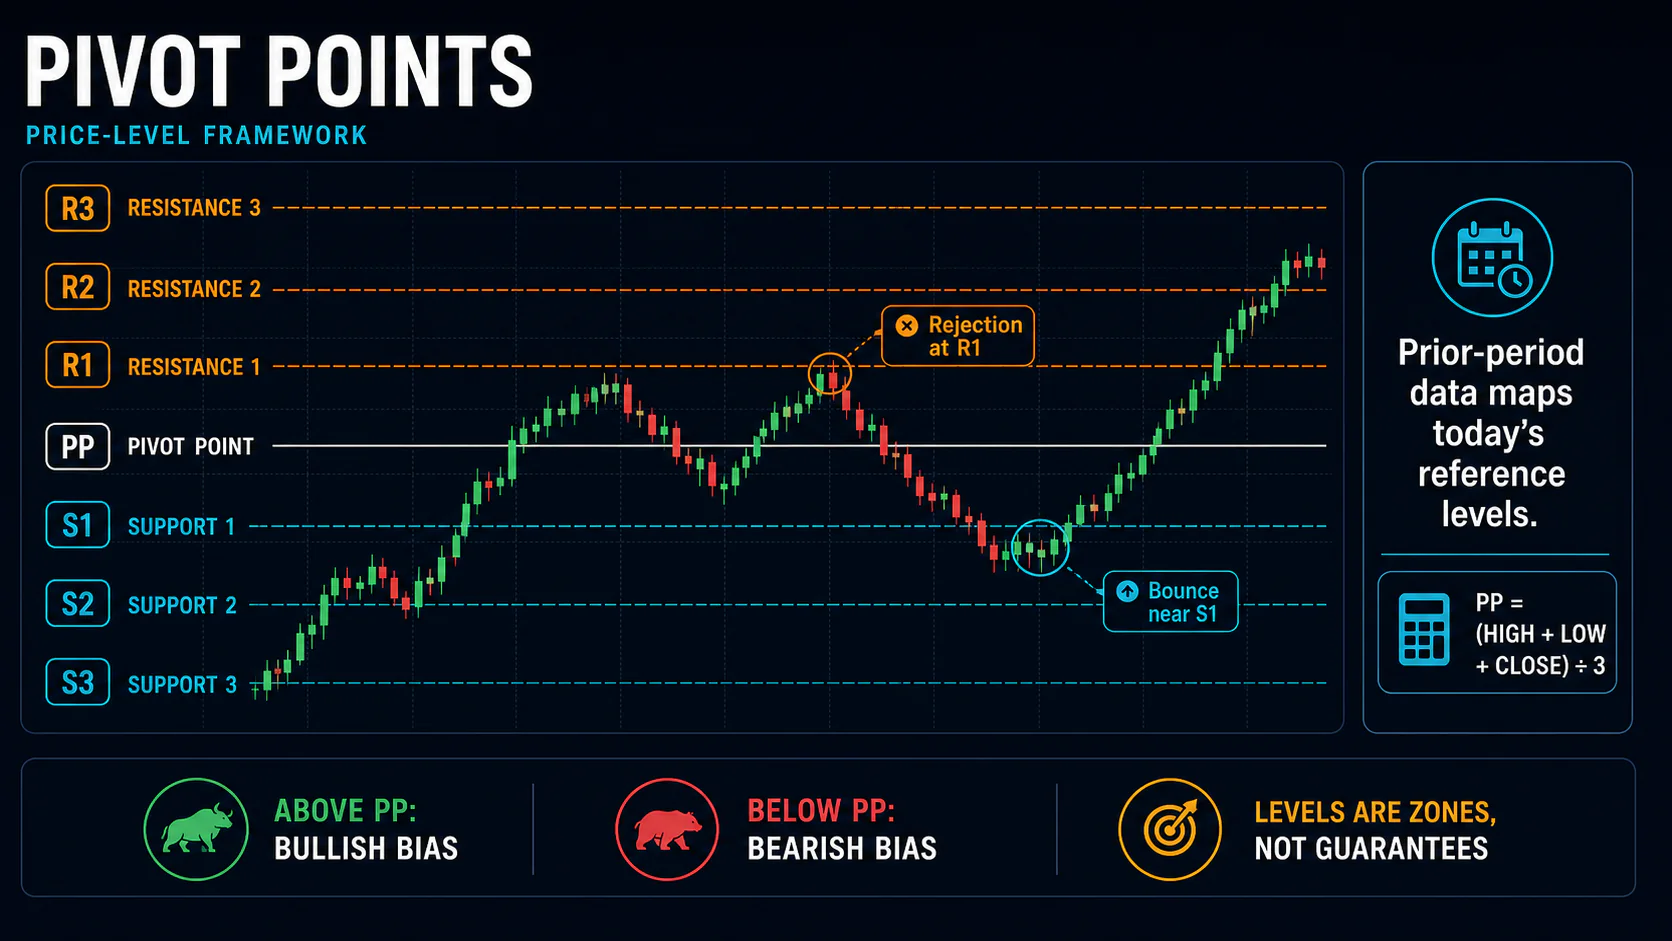
The central pivot point (PP) sits at roughly the midpoint of the prior period's trading, with resistance levels (R1, R2, R3) extending above it and support levels (S1, S2, S3) extending below. Because pivots are calculated from public price data using a well-known formula, many traders and algorithms reference the same levels — which is part of why price often reacts around them. That doesn't make the levels magic; it makes them a widely shared, self-reinforcing reference point, similar to round numbers.
Key Uses
- Support/Resistance Levels: Objective, pre-calculated reference prices
- Day Trading: Static levels set before the session that don't need to be redrawn intraday
- Entry/Exit and Target Setting: Clear levels for planning trades and profit targets
- Bias Gauge: Price above or below the central pivot gives a simple directional read
How Pivot Points Work
Standard (Floor Trader) Formula
PP = (High + Low + Close) / 3
Resistance: R1 = (2 × PP) − Low | R2 = PP + (High − Low) | R3 = High + 2 × (PP − Low)
Support: S1 = (2 × PP) − High | S2 = PP − (High − Low) | S3 = Low − 2 × (High − PP)
High, Low, and Close are taken from the prior trading period (day, week, or month, depending on the timeframe being analyzed).
Other Variants
Woodie's Pivots weight the close more heavily: PP = (High + Low + 2 × Close) / 4, making the central pivot more responsive to where the period actually closed.
Camarilla Pivots, introduced in 1989 by bond trader Nick Scott, use multipliers of the day's range (1.1/2, 1.1/4, 1.1/6, 1.1/12) added to or subtracted from the close rather than the high/low, producing levels clustered closer to price — a design geared toward range/mean-reversion trading rather than breakouts.
Fibonacci Pivots apply Fibonacci ratios to the prior range around the standard PP: R1 = PP + 0.382 × (High − Low), R2 = PP + 0.618 × (High − Low), and so on, appealing to traders who already use Fibonacci retracements elsewhere.
DeMark Pivots use a conditional formula based on whether the period closed above or below its open: if Close < Open, X = High + 2×Low + Close; if Close > Open, X = 2×High + Low + Close; if Close = Open, X = High + Low + 2×Close. The single pivot is then PP = X / 4 — DeMark's method produces only one projected level rather than a full set of support/resistance tiers.
Calculation Periods
Daily pivots use the prior day's data and are the most common for day trading; weekly and monthly pivots use the corresponding longer periods and are used for swing and position-level context. Forex and other 24-hour markets sometimes calculate session pivots (Asian/European/US) in addition to daily ones.
Interpreting Pivot Levels
Price above the central pivot is generally read as a bullish bias for the session; price below is read as bearish. S1/R1 are reached far more often than S2/R2, and S3/R3 more rarely still — think of the levels as a rough hierarchy of increasingly less likely, but more significant when hit, extremes rather than as equally probable targets. At any given level, price may bounce (reverse), break through decisively, or test it multiple times before eventually giving way — watching volume and candlestick behavior at the level is how traders distinguish which is more likely in the moment.
Trading Strategies
Bounce (Mean Reversion)
Look for a reversal signal — a rejection candle, a hammer or shooting star, a momentum divergence — as price approaches a support or resistance level, and trade back toward the central pivot or the next level. This approach fits range-bound conditions better than strongly trending ones.
Breakout
When price breaks through a pivot level with volume, a common approach is to wait for a retest of the broken level (now acting as the opposite type of level) before entering in the breakout direction, targeting the next pivot level out.
Central Pivot Bias
Use the position of price relative to the PP as a simple filter: only take long setups while price holds above PP, or only take shorts while it holds below, and treat the PP itself as a natural first target or trailing reference.
Combining Pivot Points with Other Indicators
A moving average (e.g., 20/50 EMA) provides a trend filter, so pivot bounce or breakout signals are only taken in the direction that agrees with the broader trend. RSI reaching oversold at a support pivot, or overbought at a resistance pivot, adds a momentum check to a bounce trade. Volume confirms whether a level is being genuinely tested (high volume, more likely to break) or lightly probed (low volume, more likely to hold), and candlestick reversal patterns at a level help with entry timing.
Market Conditions
In trending markets, pivot levels tend to get broken through more often than they hold, so breakout-style approaches work better and reversal signals at outer levels (R3/S3) are less reliable. In range-bound markets, pivots are respected more consistently and bounce strategies between two established levels tend to work well. In highly volatile conditions, price can spike through a level briefly before reversing, so wider stops and stronger confirmation (volume, a decisive close beyond the level rather than just a touch) become more important.
Common Mistakes
- Mismatched timeframes: using daily pivots while trading off a weekly chart, or vice versa — match the pivot period to the trading timeframe.
- Ignoring the broader trend: taking reversal signals at pivot levels against a strong prevailing trend.
- Skipping volume confirmation: treating every touch of a level the same regardless of the volume behind it.
- Placing stops too close: stops should sit beyond the pivot level with a volatility-based buffer (for example a fraction of the ATR) rather than an arbitrary fixed distance, since a level can be probed slightly before holding.
- Overcomplicating with multiple pivot types at once: master standard pivots before layering in Woodie's, Camarilla, or Fibonacci variants.
FAQs
How are pivot points different from regular support and resistance?
Pivot points are calculated with a fixed formula from the prior period's high, low, and close, while traditional support and resistance are drawn subjectively from historical price action. Pivots give an exact, repeatable price before the session even opens.
Which pivot calculation method is best?
Standard pivots are the most widely used and a reasonable default. Woodie's weights the close more heavily, Camarilla is geared toward range trading, and Fibonacci pivots suit traders already using Fibonacci elsewhere. There's no single "best" — start with standard and only add variants with a specific reason to.
How far should stops be placed from pivot levels?
Rather than a fixed distance, size the buffer to the instrument's recent volatility — for example a fraction of the Average True Range — placed just beyond the level being traded.
Do pivot points work in all market conditions?
They tend to work best in range-bound or mildly trending markets. During strong trends or around major news events, price can blow through several levels without reacting to any of them.
How do you handle a gap that opens beyond a pivot level?
A gap through a level often signals strong momentum. Many traders wait to see whether price fills back toward the level or establishes new support/resistance at the gap itself before trading it.
How long do pivot levels stay relevant?
A daily pivot is calculated for that trading day, a weekly pivot for that week, and so on — but levels that were heavily traded often continue to act as reference points even after the calculation period has technically ended.
Conclusion
Pivot points give traders a small set of objective, pre-calculated levels derived from a simple formula applied to the prior period's range. Their usefulness comes less from any inherent predictive power and more from the fact that many market participants reference the same levels, making them a self-fulfilling — but real — area of interest. Used with volume confirmation, a trend filter, and sound risk management, they're a practical framework for planning entries, exits, and targets rather than a set of levels that will always hold.