Double Top Pattern
Updated Aug 26, 2026
- Display Type
- Chart Pattern
- Complexity
- Beginner to Intermediate
- Best For
- Trend Reversal Detection, Resistance Level Confirmation, Entry/Exit Signals, Quick Reversal Identification
On this page
Double Top is a bearish reversal pattern that forms when price tests the same resistance level twice and fails to break through, separated by a moderate decline. It is one of the simpler reversal patterns to spot, which makes it a good starting point for traders learning to read chart structure, while still being widely used by experienced traders as well.
What Is a Double Top?
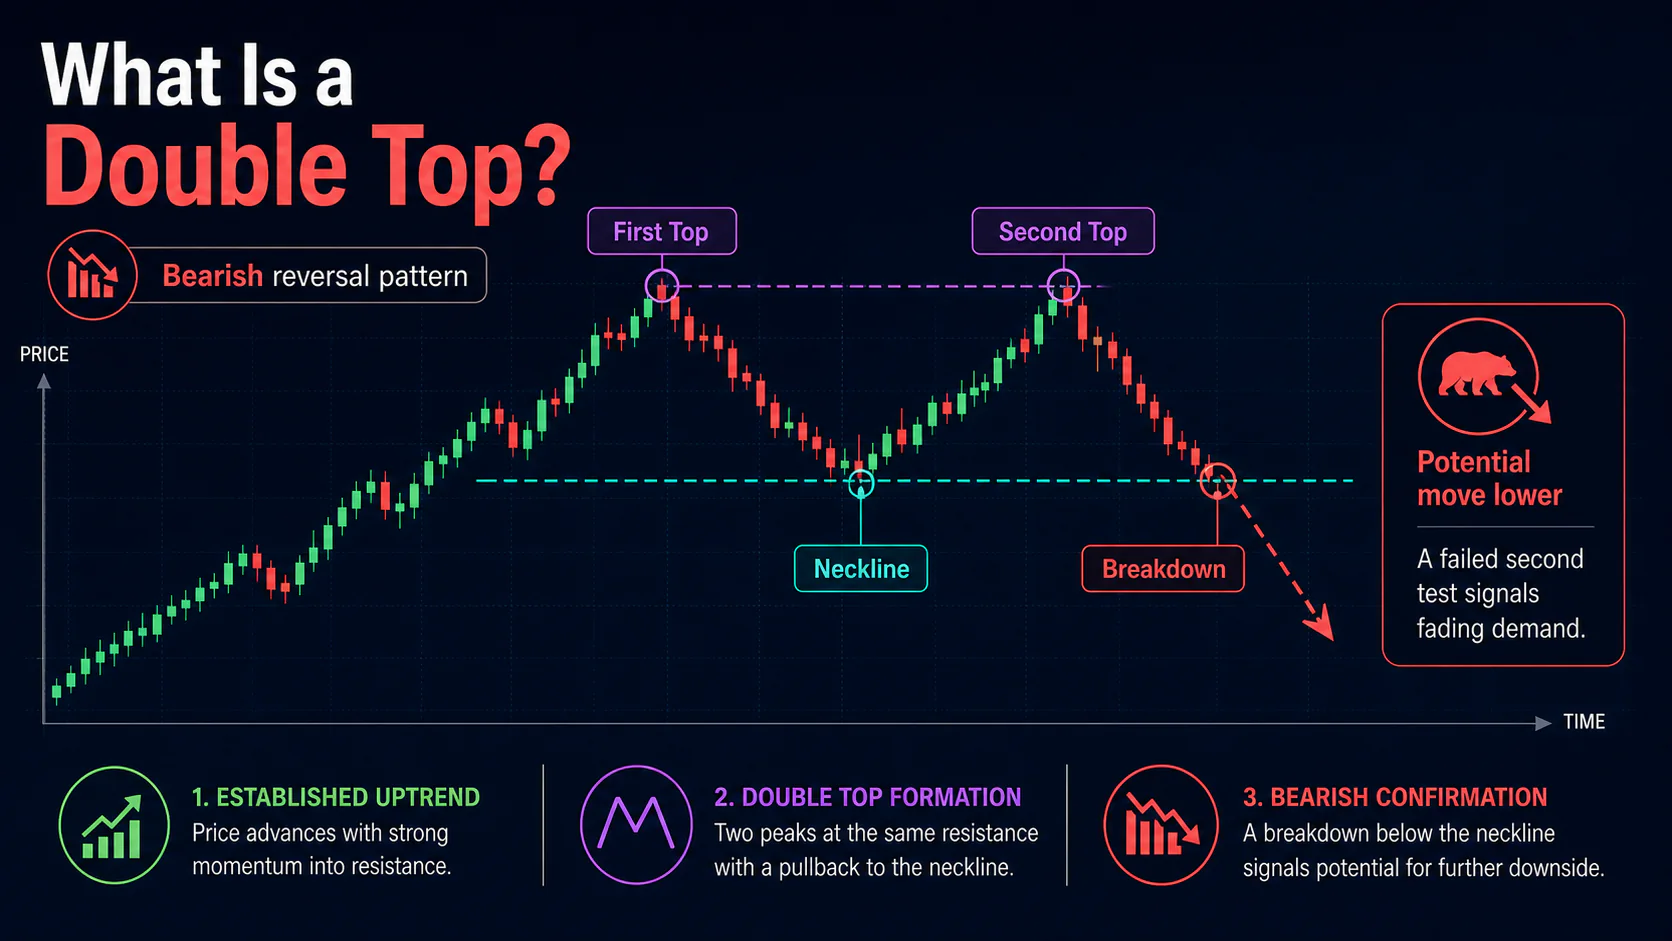
The pattern consists of two peaks of roughly equal height separated by a valley; the low point of that valley, once connected across the pattern, forms the neckline. A close below the neckline confirms the pattern and signals a likely shift from bullish to bearish. The failure to make a convincing new high on the second attempt typically triggers profit-taking from existing longs and draws in new short sellers, which is what drives the subsequent decline once the neckline gives way.
Key Uses
- Trend Reversal Identification: Signals the end of an uptrend
- Resistance Confirmation: Validates a key resistance level through two tests
- Defined Entries and Stops: The neckline break and pattern highs give clear entry and risk levels
- Target Calculation: Pattern height gives a measured-move target
Anatomy of the Pattern
First Peak: The initial test of resistance, usually formed on solid volume as the existing uptrend continues.
Valley: The decline between the two peaks, typically a moderate retracement from the first peak. This is profit-taking, not a breakdown — it sets up the second test of resistance.
Second Peak: A second test of the same resistance level, usually within a few percent of the first peak's height. It is a warning sign, not a confirmation of validity, when the second peak forms on noticeably lower volume than the first — that divergence signals fading buying conviction even before the neckline breaks.
Neckline: The support line at the valley low. A decisive close below it confirms the pattern is complete.
Volume Confirmation
The classic volume signature is a strong first peak followed by a distinctly weaker second peak — price makes an equal (or marginally higher) high while volume makes a lower high. The neckline break should occur on volume clearly above the recent average; a breakdown on light volume is less trustworthy. A small second peak that is slightly above the first can still be a valid, and sometimes more deceptive, Double Top if the volume divergence is present — traders should weight volume over the exact peak-to-peak height difference.
Pattern Variations
Second Peak Slightly Higher: A marginal new high on weaker volume than the first peak can still complete a valid Double Top, and can trap late buyers who chased the new high right before the reversal.
Second Peak Lower: A second peak that fails to reach the first peak's level is a more obvious sign of weakening demand and often leads to a quicker break of the neckline.
Complex Double Top: Occasionally more than two tests of the same resistance occur before the pattern resolves, extending the formation period. The same neckline logic applies once the pattern finally breaks.
When a third test of resistance occurs at the same level, the setup becomes a Triple Top rather than a Double Top.
Trading Strategies
Breakout Entry: Wait for a decisive close below the neckline, ideally on above-average volume, then enter short on the break or a slight retest of the neckline from below. Place a stop above the second peak (or above the neckline for a tighter stop). The minimum target is the pattern height (peak to neckline) projected downward from the breakout point.
Second Peak Rejection: More experienced traders sometimes enter short as the second peak forms and shows a clear rejection candle on lower volume than the first peak. This offers an earlier entry and better risk-reward but comes with a higher failure rate since the pattern is not yet confirmed; the stop needs to sit above both peaks.
Retest Entry: After the initial break, price sometimes returns to test the broken neckline as resistance. Entering short on a failed retest gives a better entry price, a tight stop just above the neckline, and added confirmation that the pattern is valid.
Combining With Other Analysis
A Double Top that forms at a well-established, historically significant resistance level or near a major moving average carries more weight than one in open space. The RSI and MACD often show bearish divergence between the two peaks — lower highs on the indicator while price makes an equal or higher high — which can reinforce the case for a reversal before the neckline actually breaks. Fibonacci retracements can also help identify where the valley low is likely to settle.
Failed Pattern Recognition
The clearest failure signal is a strong breakout above the second peak on solid volume, especially if the neckline has held on multiple prior tests. A failed Double Top often reverses sharply higher as short sellers cover, so traders who spot the failure early sometimes flip to the long side, targeting a measured move above resistance.
Common Mistakes
Calling the pattern too early: Identifying a Double Top before the second peak has actually formed and rolled over.
Ignoring volume divergence: Trading the setup without confirming that the second peak formed on lighter volume than the first.
Weak risk management: Not placing a stop above the pattern highs, or sizing too aggressively relative to that stop.
Ignoring market context: Trading the pattern against a strong prevailing trend without additional confirmation.
FAQs
How reliable is the Double Top pattern?
It tends to work best when it forms at a well-established resistance level and shows clear volume divergence between the two peaks. As with any chart pattern, it's more of a probability tool than a guarantee, and it works best alongside volume and trend context rather than on its own.
What's the difference between Double Top and Double Bottom?
Double Top is a bearish reversal pattern that forms at market tops; Double Bottom is the bullish mirror image that forms at market bottoms. The volume and psychology are reversed accordingly.
How do you calculate Double Top price targets?
Measure the vertical distance from the peaks to the neckline, then project that same distance downward from the point where the neckline breaks. That's the minimum measured-move target; prior support levels can serve as additional targets.
Can Double Top patterns fail?
Yes. A pattern fails when price breaks convincingly above the second peak on strong volume, which often leads to a powerful move higher as the failed reversal gets unwound.
What volume pattern confirms a Double Top?
The first peak should show solid volume, the second peak noticeably lower volume, and the neckline break should occur on volume above the recent average.
What's the best entry point?
The most conservative entry is a decisive close below the neckline with volume confirmation; more active traders sometimes enter near the second-peak rejection, while patient traders wait for a retest of the broken neckline.
Conclusion
Double Top is one of the more approachable reversal patterns because the structure is simple: two peaks at a similar level, a neckline, and a break that confirms the reversal. Its reliability improves considerably when the pattern forms at a genuinely significant resistance level and shows clear volume divergence between the two peaks — used with that context, it gives traders a clean framework for spotting resistance failures and positioning for a trend change.