Wedge Pattern (Falling)
Updated Aug 26, 2026
- Signal
- Bullish
- Reliability
- High
- Volume Confirmation
- Required
- Market Conditions
- Works best in trending and bottoming markets
On this page
A falling wedge forms when price makes a series of lower highs and lower lows, but the two trendlines connecting them both slope downward and converge, with the lower (support) line falling more slowly than the upper (resistance) line. Despite the downward slope, it is treated as a bullish pattern: it typically appears when a downtrend is losing momentum and resolves with a break above the upper resistance line. This guide explains how to identify a genuine falling wedge, how volume should behave inside it, and how to set realistic targets.
What Is a Falling Wedge?
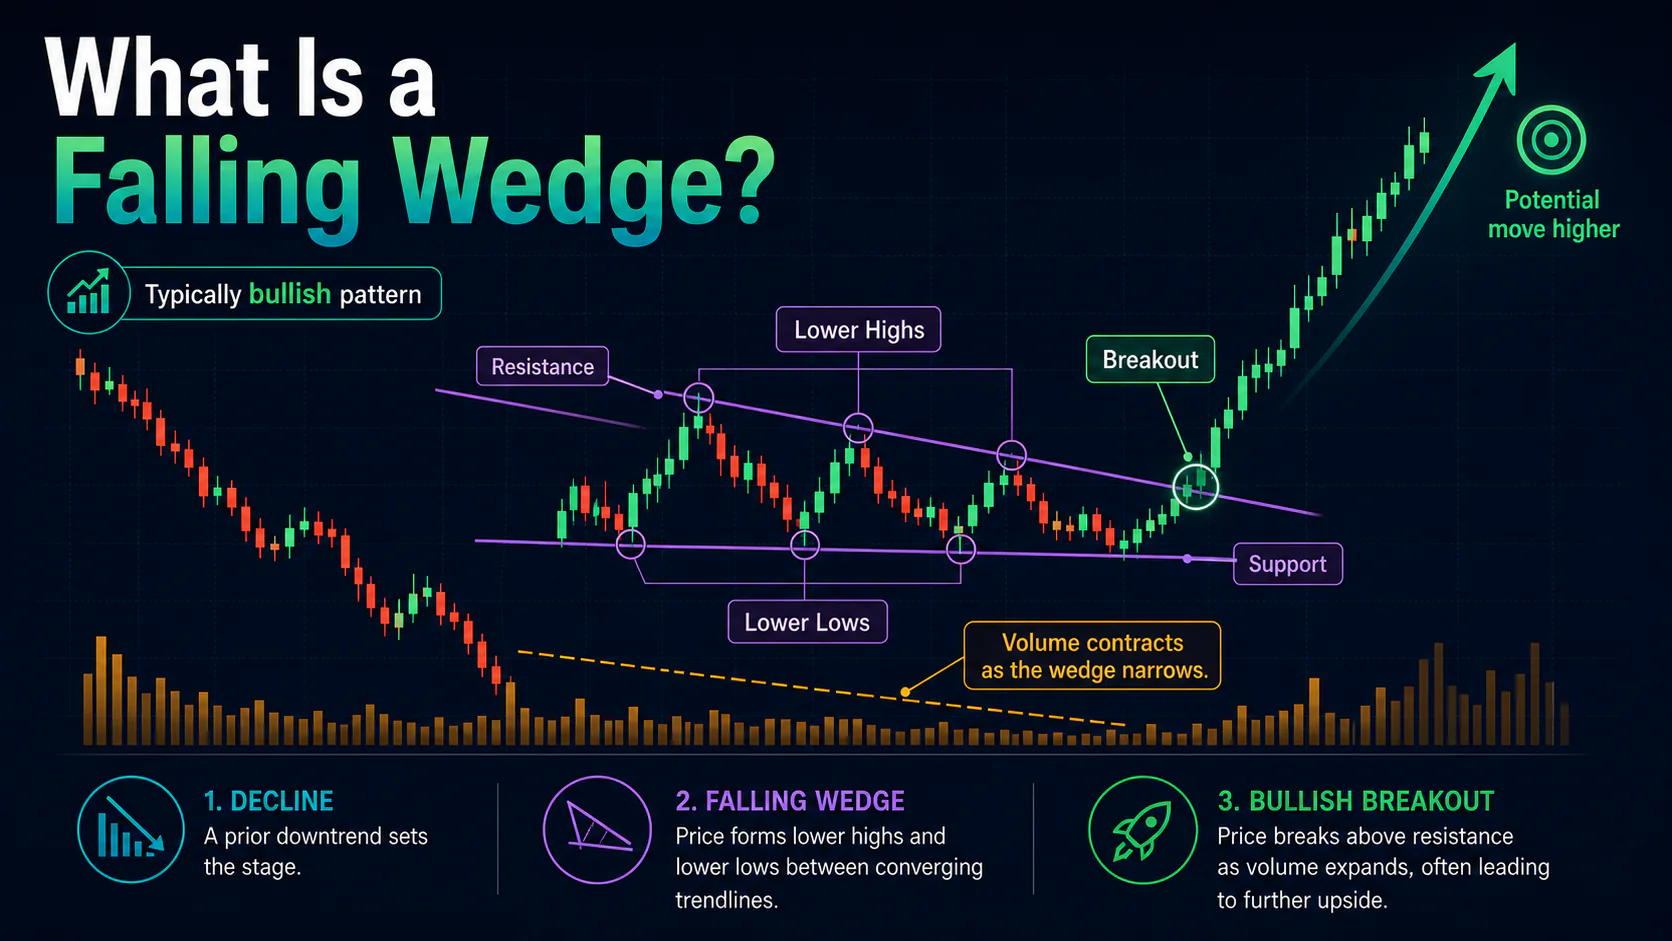
Both boundary lines slope downward, but the resistance line (connecting lower highs) falls more gently than the support line (connecting lower lows), so the range narrows as the pattern develops. Each new low is being made with less downside follow-through than the last, and selling volume typically fades even as price keeps drifting lower — a sign that downward momentum is weakening before the trend visibly turns. When price breaks above the resistance line, it signals that sellers have been overwhelmed by buyers.
As a reversal pattern, a falling wedge most often marks the end of a downtrend, usually after an extended decline. The same shape can also appear mid-advance, as a brief corrective dip within a larger uptrend before that uptrend resumes; in that context it behaves more like a continuation pattern than a bottom.
Anatomy of the Pattern
Lower Support Line
- Connects a series of lower lows
- Falls more steeply than resistance, so the two lines converge
Upper Resistance Line
- Connects a series of lower highs
- Falls more gently than support — each rally holds up better than the geometry of the pattern would suggest
Breakout Point
- A decisive close above the resistance line, ideally with a pickup in volume
- Tends to occur before the lines fully converge
Pattern Psychology
A falling wedge usually develops after a downtrend has been running for a while. Price keeps setting new lows, which looks bearish on the surface, but each decline requires less selling pressure and attracts less participation than the one before — volume should be contracting through the formation even as price grinds lower. That divergence between price and volume/momentum reflects sellers running out of conviction while buyers become more willing to step in at each new low. When resistance finally breaks, the sellers who had been defending each bounce are forced to cover, often triggering a fast advance as stops are hit.
Variations Worth Knowing
Reversal (bottoming) wedge: the most common form, appearing after an extended downtrend, often near a prior support level or in oversold territory. This is the classic setup described above.
Continuation wedge: a falling wedge can also form as a corrective dip within an established uptrend. Here the "bullish" resolution simply continues the pre-existing advance rather than reversing a bottom, and the pattern tends to be shorter and less pronounced than a true reversal wedge.
Trading Strategies
1. Breakout Entry
Wait for a decisive close above the resistance line, ideally with a volume increase, then enter long on the break or a modest pullback into the broken resistance. Place a stop below the most recent swing low, or below the lower support line for extra room.
2. Support Bounce Entry
More active traders buy into bounces from the lower trendline, particularly when accompanied by a bullish reversal candle and visible momentum divergence. This offers a tighter stop but carries more risk, since the pattern isn't confirmed until resistance actually breaks.
3. Retest Entry
After the initial breakout, price often pulls back to retest the broken resistance line, which should now act as support. A successful retest offers a lower-risk, better-confirmed entry than chasing the initial break.
Setting Targets
The most reliable target for a falling wedge is a retracement back toward the price level where the wedge began — its origin — rather than a fixed height projection. Some traders also measure the vertical height at the widest part of the wedge and project that distance above the breakout as a secondary, more conservative target, but the return-to-origin objective has a stronger basis in how these patterns typically play out and should be treated as the primary expectation.
Volume Confirmation
Volume is the single most important confirming factor for a falling wedge. It should decline steadily as the pattern forms, with each new low made on lighter volume than the low before it — a clear positive divergence between price and volume. The breakout should occur on a visible pickup in volume, ideally exceeding any volume spike seen during the formation itself; a breakout on unremarkable volume is far less trustworthy.
Combining with Other Indicators
RSI showing higher lows while price makes lower lows (bullish divergence) is one of the more useful confirming signals for this pattern, and an RSI move above 50 on the breakout adds weight. A bullish MACD crossover, or a MACD line that fails to confirm price's lower lows, provides similar confirmation. Treat these as supporting evidence rather than standalone signals.
Common Mistakes
Confusing it with a descending triangle. In a falling wedge, both lines slope downward and converge; a descending triangle has flat support and a single falling resistance line. The two patterns carry opposite implications.
Ignoring the volume requirement. Without a clear volume decline through the formation, the pattern is much less trustworthy.
Acting before the break. Entering long well before resistance actually breaks risks getting caught in a continuing decline.
Fixed height-projection targets. Treating the height projection as the primary target overstates how far these patterns typically travel; the origin of the wedge is the more realistic objective.
Ignoring context. A falling wedge after a long, extended downtrend carries more weight than one that appears early in a new decline.
Falling Wedge vs. Descending Triangle
A falling wedge has two converging downward-sloping lines and is bullish; a descending triangle has flat support with a single falling resistance line and is bearish. The wedge reflects fading downside momentum and volume even as price declines, while the triangle reflects sellers becoming progressively more aggressive against a fixed floor.
FAQs
Is a falling wedge always bullish?
It's treated as bullish in both its common forms — as a reversal after a downtrend, or as a continuation pattern within an existing uptrend. What differs between the two is simply what the eventual breakout continues or reverses, not the direction of the resolution itself.
How do you set a price target for a falling wedge?
The most commonly used target is a retracement back to the price level where the wedge began. A height-projection measurement (the widest part of the wedge projected above the breakout) is sometimes used as a secondary, more conservative target.
Can a falling wedge fail?
Yes — if price breaks below the lower support line on strong volume instead of breaking out, the pattern has failed, and that failure can lead to a sharp continuation of the prior downtrend.
What volume pattern confirms a falling wedge?
Volume should decline steadily as the pattern forms, creating a clear divergence against the falling price. The breakout should come with a noticeable pickup in volume.
What's the best entry for a falling wedge?
The most conservative entry is a decisive close above the resistance line with volume confirmation. More active traders enter on bounces from the lower trendline during formation, while patient traders wait for a retest of broken resistance before entering.
Conclusion
A falling wedge looks bearish at a glance — price is still making lower lows — but the narrowing range and fading volume reveal selling pressure that's losing conviction. The pattern typically resolves with a break of resistance, and the most realistic target is usually a return toward where the wedge began rather than an aggressive height projection. As with any reversal signal, weigh it against the broader trend and confirm with volume before acting.