Triangle Pattern (Descending)
Updated Aug 26, 2026
- Signal
- Bearish
- Reliability
- High
- Volume Confirmation
- Required
- Market Conditions
- Works best in trending markets
On this page
A descending triangle is a chart pattern formed by a flat horizontal support line along the bottom and a downward-sloping resistance line along the top, so the two lines converge toward a point on the right. It is generally treated as a bearish continuation pattern: each rally fails at a lower high than the last, while the same support level holds, and the pattern usually resolves with a break below that support. This guide covers how the pattern forms, how to trade it, and how to tell a real breakdown from a false one.
What Is a Descending Triangle?
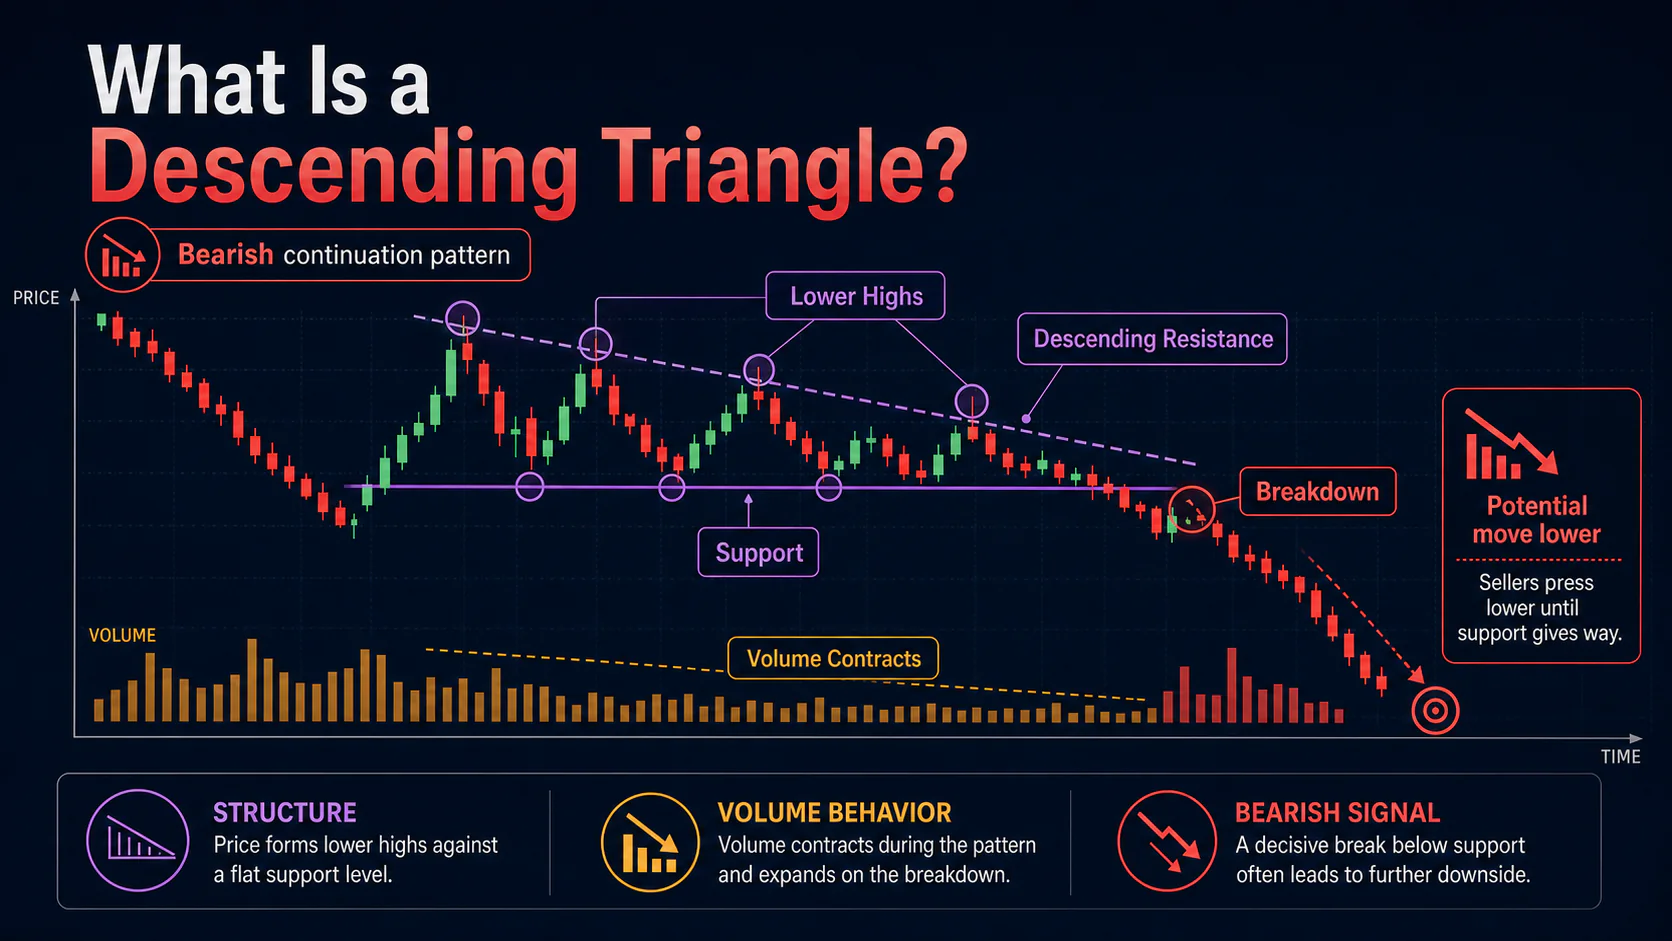
The pattern consists of two converging trendlines: a horizontal line connecting a series of roughly equal lows, and a descending line connecting a series of lower highs. Because sellers are willing to sell at progressively lower prices while buyers keep defending the same support level, the range compresses over time. When support finally gives way, the breakdown is read as a continuation of the prior downtrend or a resolution of the standoff in the seller's favor.
Descending triangles can also appear within an uptrend as a corrective pause, in which case the eventual breakdown represents a shorter, less severe pullback rather than a resumption of a larger downtrend. Context — where the pattern sits relative to the prevailing trend — matters as much as the shape itself.
Anatomy of the Pattern
Horizontal Support
- A flat line connecting two or more swing lows at approximately the same price
- Often coincides with a round number or a previously significant level
- Becomes resistance if the breakdown is confirmed
Descending Resistance
- A downward-sloping trendline connecting a series of lower highs
- Reflects sellers stepping in earlier at each successive test
Breakdown Point
- A decisive close below horizontal support, ideally on increased volume
- Tends to occur before the two lines fully converge rather than at the apex
- Triggers the measured-move target described under Trading Strategies below
Pattern Psychology
Early in the pattern, support holds because buyers still see value at that level, producing a bounce each time price tests it. But each subsequent rally attracts selling at a lower price than before, showing that sellers are becoming more aggressive while buyers are not pushing back. Volume typically drifts lower through the formation as the standoff continues — a sign of temporary equilibrium, not resolution. When support finally breaks, the traders who had been defending that level are forced out, and the resulting stop-loss selling and fresh short interest often accelerate the decline.
Variations Worth Knowing
False breakdown ("bear trap"): price briefly closes below support, then reverses back inside the pattern. This shakes out early shorts before the real move; if it happens on comparatively light volume and price quickly reclaims the range, treat the pattern as still valid rather than failed.
Sloped support: real-world support lines are rarely perfectly flat. A support line with a slight tilt still qualifies as a descending triangle as long as it is clearly flatter than the resistance line above it; what matters is the convergence and the repeated tests of a similar floor, not geometric perfection.
Trading Strategies
1. Breakdown Entry
The most conservative approach: wait for a decisive close below support with volume noticeably above the recent average, then enter short on the break or on a modest pullback into the broken level. Place a stop above the most recent swing high, or above the descending resistance line for a wider berth. This approach sacrifices some entry price for confirmation.
2. Resistance Rejection Entry
More aggressive traders sell into the pattern itself, entering when price is rejected from the descending resistance line with a bearish reversal candle. This offers a tighter stop (just above the rejection high) and a better average entry price if the pattern completes, but the pattern is not yet confirmed and can still break upward.
3. Retest Entry
After an initial breakdown, price sometimes rallies back to retest the old support level, which should now act as resistance. A failed retest — price turns back down from that level — offers confirmation of the breakdown and a lower-risk entry than chasing the initial break, with a stop just above the retest high.
Setting Targets
The standard measured-move target is the vertical height of the triangle (from horizontal support to the highest point of the pattern), projected downward from the breakdown point. Treat this as a minimum objective rather than a guarantee — prior support levels and Fibonacci extensions of the pattern height can offer secondary targets if the decline continues past the initial measured move.
Volume Confirmation
Volume should generally contract as the pattern forms, reflecting the temporary standoff between buyers and sellers. The breakdown itself should come on a clear pickup in volume relative to the recent average — ideally the highest-volume session of the entire formation — with volume holding up rather than immediately fading in the sessions that follow. A breakdown on unremarkable volume is more prone to failure and reversal.
Combining with Other Indicators
Momentum indicators add useful confirmation. RSI making lower highs alongside price's lower highs (bearish divergence) reinforces the distribution read, and an RSI move below 50 on the breakdown supports the signal. A bearish MACD crossover or a MACD line making lower highs through the formation adds further confirmation. Neither indicator is required, but agreement across price, volume, and momentum reduces the odds of a false signal.
Failed Patterns
A descending triangle fails when price breaks above the descending resistance line, particularly on strong volume — this can mark the end of the downtrend rather than its continuation. Repeated false breakdowns without follow-through, or a broad improvement in the underlying market, are early warning signs. A confirmed upside breakout can be traded in the opposite direction, targeting a measured move above resistance equal to the pattern's height.
Common Mistakes
Calling the pattern too early. Wait for at least two clear touches of support and three of resistance before treating the shape as a valid triangle.
Ignoring volume. A breakdown on light volume is far more likely to fail than one confirmed by a genuine pickup in participation.
Chasing the breakdown. Entering well after the initial break, with a wide stop, worsens the risk-reward of the trade.
Fighting the broader trend. The pattern is most reliable as a continuation signal within an existing downtrend; treat triangles that form against the larger trend with more skepticism.
Skipping risk management. Place a stop above resistance (or the most recent swing high) and size the position so that a stop-out is a small, planned loss.
Descending Triangle vs. Ascending Triangle
The two patterns are mirror images. A descending triangle has flat support and falling resistance and is read as bearish; an ascending triangle has flat resistance and rising support and is read as bullish. Volume and psychology are likewise inverted — a descending triangle reflects sellers becoming more aggressive while buyers hold a fixed line, while an ascending triangle reflects buyers becoming more aggressive while sellers hold a fixed line.
FAQs
Is a descending triangle always bearish?
It is a bearish-continuation pattern by default, most reliable when it forms within an existing downtrend. When it forms during an uptrend, it more often represents a shorter corrective pause than a full trend reversal, and traders should weigh the broader trend before assuming a large decline will follow.
How do you calculate a descending triangle's price target?
Measure the vertical distance from the horizontal support line to the highest point of the pattern, then project that same distance downward from the breakdown point. This is a minimum target — treat prior support levels and Fibonacci extensions as secondary objectives if the move continues.
Can a descending triangle fail?
Yes. If price breaks above the descending resistance line instead of below support, the pattern has failed and may mark a trend reversal rather than a continuation. Failed patterns can produce sharp moves in the opposite direction.
What volume pattern confirms a descending triangle?
Volume should generally decline as the pattern forms, then increase noticeably on the breakdown itself. Sustained volume in the days following the break adds further confirmation.
How long does a descending triangle take to form?
There's no fixed rule, but patterns that develop over several weeks on a daily chart tend to be more dependable than very short-lived versions of the shape, which are easier to mistake for random noise.
Conclusion
A descending triangle combines a fixed support level with a series of lower highs, and it typically resolves with a break of that support in line with the prevailing trend. The pattern's value lies in its clear structure: a defined support level for stop placement, a measurable height for setting targets, and a specific volume signature to confirm the breakdown. As with any chart pattern, it works best as one input alongside broader trend context, volume, and momentum confirmation rather than as a signal to trade in isolation.