Double Bottom Pattern
Updated Aug 26, 2026
- Signal
- Bullish
- Reliability
- High
- Volume Confirmation
- Required
- Market Conditions
- Works best in trending and bottoming markets
On this page
Double Bottom is a bullish reversal pattern that forms when price tests the same support level twice after a downtrend, separated by an intermediate rally. It signals that selling pressure is exhausted and buyers are stepping in, and it's one of the more approachable reversal patterns for traders learning to read chart structure.
What Is a Double Bottom?
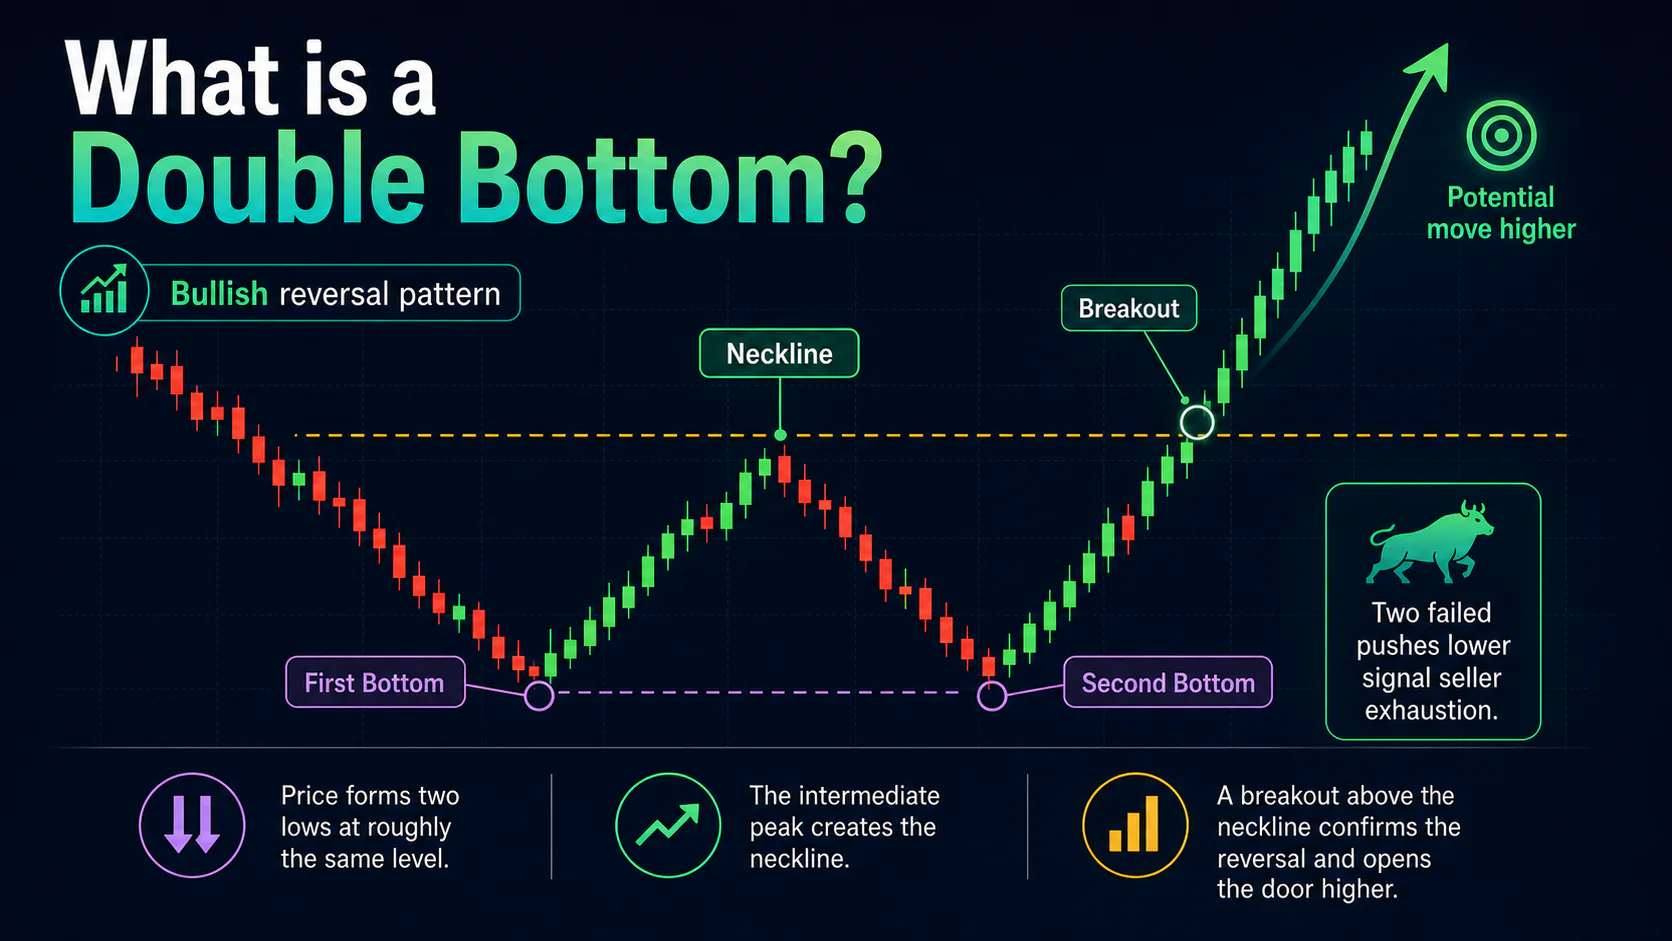
The pattern consists of two lows at approximately the same level with an intermediate peak between them, which forms the neckline (resistance) once connected. A close above the neckline, ideally on strong volume, confirms the reversal from downtrend to uptrend. Each test of the low that fails to break lower demonstrates that sellers can no longer push price down, while the rally into the neckline shows buyers gaining conviction.
Key Uses
- Trend Reversal Identification: Signals the end of a downtrend
- Bottom Recognition: Helps identify major or intermediate market bottoms
- Defined Entries and Stops: The neckline break and pattern lows give clear entry and risk levels
- Target Calculation: Pattern height gives a measured-move target
Anatomy of the Pattern
First Bottom: The initial low following a sustained downtrend, often on heavy volume as selling reaches a climax.
Neckline (Intermediate Peak): The rally off the first bottom, which forms the resistance level. Its height above the bottoms determines the measured-move target.
Second Bottom: A second test of the same low, ideally within a few percent of the first. A lower volume reading on this second test than on the first is the key confirmation signal — it shows sellers losing conviction even as price revisits the same level.
Neckline Breakout: A decisive move above the intermediate peak, ideally on volume clearly above the recent average, confirms the pattern.
Volume Confirmation
The classic signature is high volume on the first bottom (often a selling climax), moderate volume on the rally to the neckline, and lower volume on the second bottom — a bullish divergence between price (matching the prior low) and volume (declining). The neckline breakout should occur on volume that expands clearly above the recent average; thin-volume breakouts are more likely to fail or need a retest before continuing.
Pattern Variations
Technical analyst Thomas Bulkowski's naming convention describes the shape of each low: an "Adam" bottom is a sharp, spike-like low with a quick reversal, while an "Eve" bottom is a rounded, saucer-like low that takes longer to form. The four combinations — Adam & Adam, Adam & Eve, Eve & Adam, and Eve & Eve — are all valid Double Bottoms; the shape mainly affects how the volume and timing play out rather than the underlying logic of the pattern. Sharper, "Adam" lows tend to come with higher volume and a faster recovery, while rounded "Eve" lows suggest a more gradual, extended base.
If a failed Double Bottom produces a third test of support instead of a clean breakout, the pattern becomes a Triple Bottom.
Trading Strategies
Breakout Entry: Wait for a decisive close above the neckline with volume above average, then enter long on the break or a modest pullback. Place a stop below the higher of the two bottoms (or below both for a more conservative stop). The minimum target is the pattern height added to the breakout point; secondary targets are prior resistance levels.
Second Bottom Entry: More experienced traders sometimes enter as the second bottom forms and shows declining volume with a clear reversal signal. This improves the risk-reward ratio with a stop below both bottoms, but the pattern isn't confirmed until the neckline actually breaks.
Retest Entry: After the initial breakout, price often pulls back to test the neckline as new support. Entering on a successful retest with supporting volume offers a better entry price than chasing the breakout.
Combining With Other Analysis
A Double Bottom that forms at a major historical support level or lines up with a declining moving average carries more weight, and a subsequent break above that moving average reinforces the reversal case. The RSI and MACD often show bullish divergence across the two bottoms — higher lows on the indicator while price makes an equal or lower low — which can lead the price confirmation. Fibonacci retracements of the prior decline can help anticipate where the neckline is likely to form.
Failed Pattern Recognition
The clearest failure signal is a breakdown below both bottoms on strong volume, which usually means the downtrend is resuming. An extended formation that never breaks the neckline is also a caution sign. When the pattern fails, exit long positions promptly — a failed Double Bottom can lead to a continuation of the prior downtrend.
Common Mistakes
Skipping the volume check: Trading the pattern without confirming that the second bottom formed on lighter volume than the first.
Calling it too early: Assuming the pattern is complete before the neckline actually breaks.
Weak risk management: Not placing a stop below the pattern lows, or oversizing the position relative to that stop.
Ignoring market context: Trading the pattern without considering the broader trend and market environment.
Double Bottom vs. Other Patterns
Vs. Head and Shoulders Bottom: The Inverse Head and Shoulders has three lows with a distinctly deeper middle low, while a Double Bottom has two lows at a similar level — a simpler structure that typically develops faster.
Vs. Triple Bottom: A Triple Bottom adds a third test of support, generally taking longer to complete but offering an extra layer of confirmation once it does break out.
Vs. Falling Wedge: A falling wedge is defined by two converging, downward-sloping trendlines rather than two discrete equal lows, and can resolve as either a reversal or a continuation depending on the prevailing trend.
FAQs
How reliable is the Double Bottom pattern?
It tends to work best when it forms after an extended downtrend and shows clear volume divergence between the two bottoms. Like any chart pattern, it's a probability tool, not a guarantee, and works best combined with volume and trend context.
What's the difference between Double Bottom and a W-pattern?
They're the same formation — the "W" name simply describes the visual shape the pattern traces on the chart.
How do you calculate price targets?
Measure the vertical height from the bottom of the pattern to the neckline, then add that distance above the point where price breaks the neckline. That's the minimum measured-move target.
Can Double Bottom patterns fail?
Yes, when price breaks below both bottoms or never manages to clear the neckline. Failed patterns often lead to a continuation of the downtrend or extended sideways movement.
What volume pattern confirms a Double Bottom?
Volume should be lower on the second bottom than the first, showing diminishing selling pressure, with the neckline breakout occurring on volume clearly above the recent average.
What's the best entry point?
The most conservative entry is a decisive close above the neckline with volume confirmation; more active traders sometimes enter near the second bottom, while patient traders wait for a pullback retest of the neckline.
Conclusion
Double Bottom gives traders a clean, visually intuitive structure for spotting trend reversals: two lows at a similar level, a neckline, and a breakout that confirms buyers have taken control. Its reliability improves when the pattern forms after a genuine downtrend and shows the expected volume divergence between the two lows — used with that context, it's a dependable tool for identifying where selling pressure has been exhausted.