Bearish Downside Gap Three Methods
Updated Aug 26, 2026
- Signal
- Bearish Continuation
- Reliability
- Moderate
- Rarity
- Extremely Rare
- Confirmation
- Required
- Trend Position
- Mid-Trend
- Best Timeframes
- Daily+
On this page
The Bearish Downside Gap Three Methods is a three-candle pattern traditionally classified as a bearish continuation signal, but it has an unusual reputation: research by Thomas Bulkowski found that it behaves as a bullish reversal more often than a bearish continuation. A long black candle is followed by a second black candle that gaps down from it, and then a white candle that opens inside the second candle's body and closes back inside the first candle's body, completely filling the gap between them. Few candlestick patterns illustrate as clearly why a name and a track record can diverge.
Recognizing the Pattern
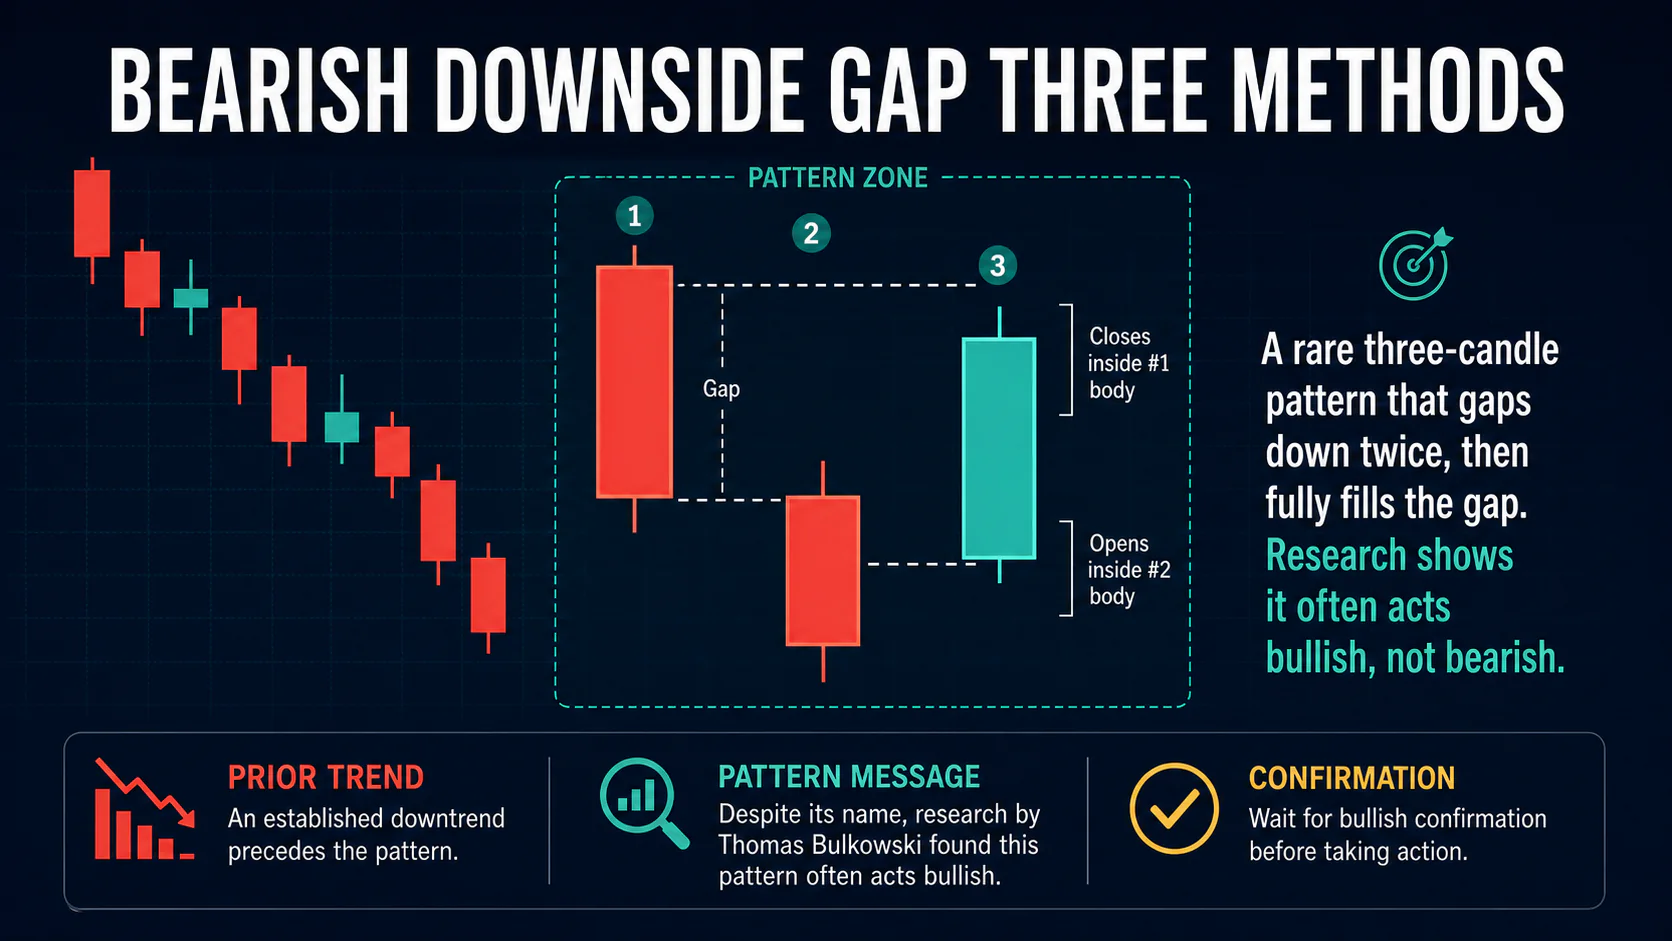
First candle: a long bearish candle appearing within an established downtrend, with a substantial real body.
Second candle: opens with a true gap down — no overlap with the first candle's low, including shadows — and continues lower with another long bearish body.
Third candle: a white (bullish) candle that opens within the second candle's real body and closes within the first candle's real body, completely closing the gap between the first two candles.
A genuine gap between the first two candles, meaning no overlap even between their shadows, is essential; without it, the pattern doesn't apply. The third candle must fully close that gap, not just partially retrace it.
Notable Variations
A larger, cleaner gap between the first two candles tends to draw more attention from other market participants, which can make the eventual resolution — whichever direction it takes — more decisive. Formation near a well-established support level is the single variation most worth watching for, since it's the condition under which the pattern's documented bullish tendency shows up most reliably.
Quick Recognition Checklist
- Established downtrend precedes the pattern
- First candle is long and bearish
- Second candle gaps down from the first with no shadow overlap
- Second candle continues lower with another long bearish body
- Third candle is white, opening inside the second candle's body
- Third candle closes inside the first candle's body, fully closing the gap
The Empirical Contradiction
Traditional candlestick theory treats the gap-filling white candle as a temporary pause before the downtrend resumes, similar in spirit to the Falling Three Methods. Bulkowski's backtesting tells a different story: he found this specific pattern resolves bullish roughly 62% of the time, and ranks it 84th out of 103 candlestick patterns by frequency, meaning it's also one of the rarer formations a trader is likely to encounter. That combination of rarity and a documented tendency to defy its own name makes it one of the more debated patterns in candlestick literature.
In practice, this means the pattern's location matters more than its label. Near major support, the gap-filling action more plausibly reflects genuine buying interest emerging rather than short-lived profit-taking, which lines up with Bulkowski's findings. Deep into a strong, well-established downtrend with no nearby support, the traditional continuation read has a somewhat better case, though even there the pattern's overall track record argues for caution.
This is also a useful reminder for candlestick analysis generally: a pattern's name and its original Japanese rice-trading classification reflect the logic of how the candles are shaped, not necessarily a guarantee about what happens next. Modern backtesting across large historical samples, as Bulkowski's research demonstrates, sometimes overturns those traditional assumptions entirely, especially for rarer formations where a handful of atypical historical examples can skew the classic interpretation.
Trading the Pattern
Entry
Given the conflicting evidence, confirmation matters more here than for most patterns. For the traditional bearish read, wait for the session after the pattern to close below the second candle's low before entering short. For the empirically-favored bullish read, wait for a close back above the gap area or the third candle's high before considering a long entry.
Stop-Loss
Whichever direction is taken, use a stop on the opposite side of the pattern's range — above the third candle's high for a short trade, or below the second candle's low for a long trade — and keep the position small, since the pattern's rarity and contradictory track record argue against building a large position around it.
Profit Targets
Target selection should follow the confirmed direction: the next support level for a bearish continuation trade, or the next resistance level for a bullish reversal trade. Because directional conviction is inherently lower with this pattern, taking a first partial profit earlier than usual is a reasonable adjustment.
Confirmation and Indicator Confluence
Because the pattern's own history argues against taking its name at face value, indicator context matters more than usual. RSI bullish divergence heading into the pattern, or its formation near a well-established support level, both tilt the odds toward the empirically more common bullish resolution described above. A clear downtrend with no nearby support and heavier volume on the two bearish candles than on the white candle offers at least some support for the traditional bearish read.
Broader market conditions add one more layer of context: in a market-wide bear phase with few nearby support levels, the traditional bearish read gets somewhat more credible; in a choppier or range-bound tape, the empirical bullish tendency is the safer assumption.
Given how rarely this pattern appears, it also pays to double-check the basics before acting on it: confirm the downtrend is genuine, confirm the gap has no shadow overlap, and confirm the third candle's close genuinely lands back inside the first candle's real body rather than merely approaching it.
Common Mistakes
- Assuming the pattern is automatically bearish just because of its name and traditional classification.
- Trading it without a true gap between the first two candles — an overlap of even the shadows invalidates the setup.
- Skipping directional confirmation given how unevenly, per Bulkowski's data, the pattern's outcomes actually split.
- Building an outsized position around a pattern this rare and this contradictory.
- Ignoring nearby support levels, which meaningfully shift the odds toward the bullish resolution.
- Forcing the pattern onto a chart where the gap only partially closes — a partial fill by the third candle does not qualify.
- Treating the pattern as tradable in isolation without checking whether a major support level sits nearby, which is the single biggest factor tilting the odds toward the bullish resolution.
FAQs
Is this pattern really more bullish than bearish?
According to Bulkowski's published research, yes — it resolves as a bullish reversal more often than as the bearish continuation its traditional name implies, which is why confirmation before trading it is especially important.
How rare is this pattern?
Very. Bulkowski ranks it 84th out of 103 candlestick patterns by frequency, so most traders will encounter it only occasionally.
What's the difference between this and the Falling Three Methods?
Falling Three Methods uses three small counter-trend candles fully contained within a single long bearish candle's range. Downside Gap Three Methods uses two separate bearish candles with a true gap between them, closed by a single white candle.
Should I trust the traditional bearish classification or the empirical data?
Given the documented contradiction, most traders are better served weighting the empirical evidence, especially near support levels, over the pattern's traditional label, and waiting for confirmation either way.
Why is it still taught if it doesn't behave as advertised?
It remains a useful case study in why traditional pattern names shouldn't be taken as guarantees, and a reminder to confirm any candlestick signal against actual price action and context rather than the label alone.
Should this pattern be a core part of a trading strategy?
Given its rarity and contradictory track record, most traders are better served treating it as an occasional curiosity to confirm carefully when it appears, rather than building a dedicated strategy around a setup this infrequent and this uncertain.
Conclusion
The Bearish Downside Gap Three Methods is less useful as a reliable trading signal than as a lesson in verifying pattern assumptions against real evidence. Its combination of rarity and Bulkowski's documented bullish tendency means traders who do encounter it should treat the name as a starting point, not a conclusion, and lean on confirmation, support and resistance context, and conservative position sizing before acting on it in either direction. When in doubt, waiting for the next session's confirmation costs little and avoids betting on a pattern whose own history argues against a confident directional call.