Bearish Hanging Man
Updated Aug 26, 2026
- Signal
- Bearish Reversal
- Reliability
- Moderate
- Rarity
- Common
- Confirmation
- Required
- Trend Position
- Uptrend Top
On this page
A bearish hanging man is a single-candle warning that can appear at the top of an uptrend. It has a hammer-shaped body — a small real body sitting near the top of the session's range with a long lower shadow — formed when sellers push price sharply lower intraday before buyers manage a partial recovery into the close. The shape alone isn't bearish; it only becomes a warning sign when it appears after a sustained advance and is confirmed by weakness in the following session. That confirmation requirement is what separates a hanging man from its bullish look-alike, the hammer.
Recognizing the Pattern
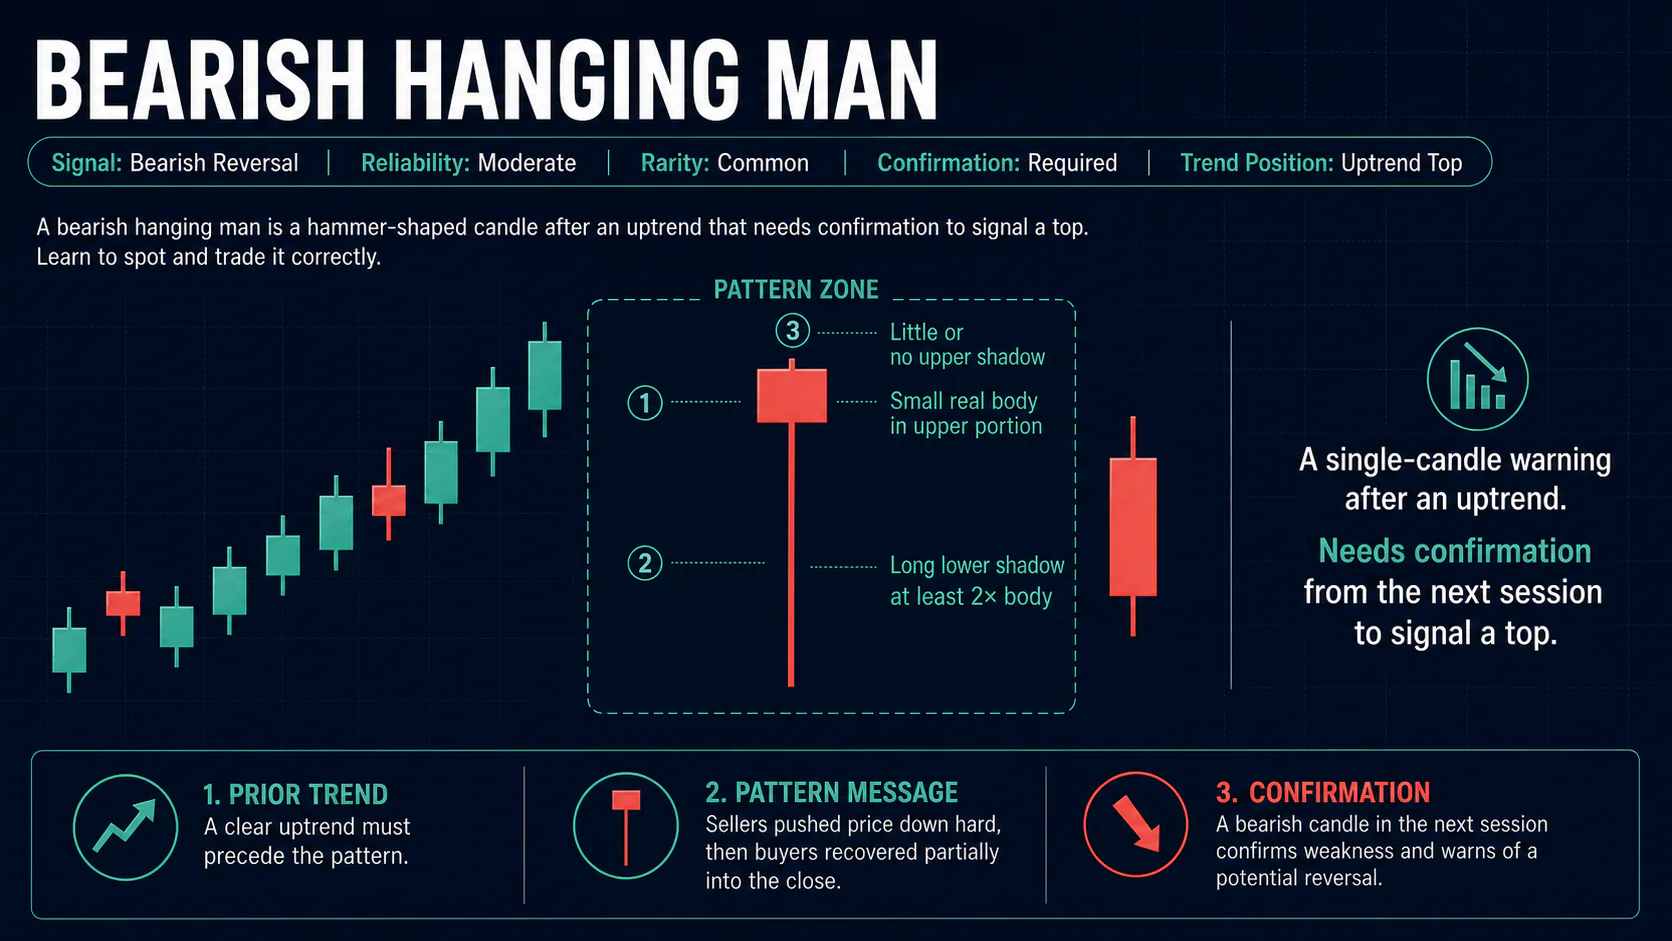
- Small real body positioned in the upper portion of the session's range, generally no more than about a third of the total high-low range.
- Long lower shadow at least twice the length of the real body, showing sellers drove price well below the eventual close.
- Little or no upper shadow, since the high was set early in the session and not exceeded again.
- A prior uptrend — without one, the same hammer shape carries no reversal significance.
The real body can be either color; a bearish (down) body adds slightly more weight but isn't required. Because the pattern's shape is identical to a hammer, only its position in the trend — after an advance rather than a decline — and subsequent confirmation determine whether it should be read as bearish.
Like most candlestick signals, a hanging man can appear on any timeframe, but it's most commonly discussed on daily charts. A hanging man on a weekly chart after a long, sustained advance tends to carry more significance than the identical shape on an intraday chart, since it reflects a fuller session of trading rather than a brief burst of noise.
Market Psychology
The session opens near the highs, continuing the uptrend's momentum, but sellers emerge and drive price sharply lower during the day. Buyers then step back in and push the close back up near the open, which on the surface looks like a recovery. The bearish takeaway isn't the recovery itself — it's that sellers were able to inflict a large intraday decline at all, something that hadn't been happening during the healthier part of the uptrend. That newfound willingness to sell into strength is the real warning; whether it develops into an actual reversal depends on what happens in the sessions that follow.
Variations
- Bearish-bodied hanging man: the close finishes slightly below the open, adding a modest amount of extra conviction to the pattern.
- Gap-up hanging man: the session gaps higher before selling off, making the intraday reversal more notable.
- Hanging man at resistance: the same shape forming at a prior high, round number, or major moving average carries more weight, since the intraday rejection coincides with an independent reason for sellers to appear.
Trading the Hanging Man
Entry: Because the pattern requires confirmation, avoid shorting on the hanging man's close alone. Wait for the next session to open lower or close below the hanging man's low before entering.
Stop-loss: Above the hanging man's high is the standard, more conservative placement. Some traders use the top of the real body for a tighter stop, accepting a higher chance of being stopped out by ordinary volatility.
Targets: Nearby support levels are the more realistic near-term objective. A downside projection roughly equal to the lower shadow's length, measured from the low, offers a rough minimum target once confirmation appears.
Confirmation
Confirmation isn't optional for this pattern. Classical sources are explicit that a hanging man is only bearish once the next session's price action validates it — typically a lower open or a close below the hanging man's low, ideally on increased volume. Without that follow-through, the pattern is simply a hammer-shaped candle inside an uptrend and carries no reversal implication on its own.
Combining with Technical Indicators
A hanging man is more persuasive when the broader technical picture already looks stretched: RSI above 70, a bearish MACD divergence, or an overbought stochastic reading. Formation at a well-established resistance level, a major moving average, or a round number adds further confluence. As with any single-candle signal, indicator agreement raises confidence but doesn't replace the need for price confirmation.
Common Mistakes
- Shorting without confirmation — the single most common way traders misuse this pattern.
- Ignoring the trend context and treating the shape as bearish outside of an uptrend.
- Accepting a lower shadow that's too short, or a body that's too large, to represent genuine intraday selling pressure.
- Placing stops too tight, which invites getting stopped out by ordinary volatility before the thesis has a chance to play out.
- Treating every hanging man the same regardless of whether it forms at a meaningful resistance level or in the middle of open air.
Where It Fits in a Trading Plan
Because the hanging man requires confirmation by definition, it works better as part of a watchlist process than as a trigger for an immediate trade. A practical approach is to flag the pattern when it appears, note the level that would confirm it (a close below the hanging man's low) and the level that would invalidate it (a close above its high), and then let the next session decide whether the setup is worth acting on. Sizing the position so that a stop-out at the invalidation level is a small, planned loss — rather than a surprise — keeps a single failed pattern from doing outsized damage to a trading account. As with other reversal patterns, tracking how hanging man setups have performed on a particular stock or in a particular market regime helps calibrate how much confidence to place in the next one.
FAQs
What's the difference between a hanging man and a hammer?
Nothing in the candle's shape — both have a small body near the top of the range and a long lower shadow. The difference is context: the same shape after a downtrend is a bullish hammer; after an uptrend, it's a bearish hanging man.
Does a hanging man always need confirmation?
Yes. Unlike some single-candle patterns where confirmation is merely recommended, most technical analysts treat it as required for the hanging man specifically, since the pattern's own session ends with a recovery that could otherwise be misread as bullish.
Does the color of the real body matter?
Only marginally. A bearish-colored (down) body adds a small amount of extra weight, but the shape — small body near the top, long lower shadow — is what defines the pattern regardless of color.
How is a hanging man different from a shooting star?
Both warn of a possible top, but the shadow sits on the opposite side: a hanging man has a long lower shadow with the body near the high, while a shooting star has a long upper shadow with the body near the low.
Where should a stop-loss go?
Above the hanging man's high for the standard, more conservative placement; some traders use the top of the real body for a tighter stop, accepting a higher chance of being stopped out by normal noise.
Can a hanging man appear more than once in the same uptrend?
Yes. An uptrend can produce several hanging man candles before it actually reverses, which is part of why the pattern is treated as a warning sign rather than a precise timing tool — each occurrence needs its own confirmation rather than assuming the first one marks the exact top.
Conclusion
The bearish hanging man flags a subtle but meaningful shift: sellers who were largely absent during the healthy part of an uptrend suddenly show up and drive a sharp intraday decline, even if buyers manage to paper over it by the close. Because the pattern's own session can look like a recovery, confirmation from the next session is essential rather than optional. Used with that discipline, and combined with resistance levels or overbought indicators, the hanging man is a useful early warning that an uptrend's character may be changing.