Bearish Harami
Updated Aug 26, 2026
- Signal
- Bearish Reversal
- Reliability
- Moderate
- Rarity
- Common
- Confirmation
- Recommended
- Trend Position
- Uptrend Top
On this page
A bearish harami is a two-candle reversal pattern that can appear at the top of an uptrend. The first candle is a large bullish candle continuing the trend; the second is a much smaller candle — of either color — whose entire real body sits inside the first candle's real body. The name comes from the Japanese word for "pregnant," describing how the small second candle appears nested inside the larger first one. That sudden contraction after a large advance is read as a sign that upward momentum may be running out, though the pattern is only a moderately reliable, early warning rather than a strong reversal trigger on its own.
Recognizing the Pattern
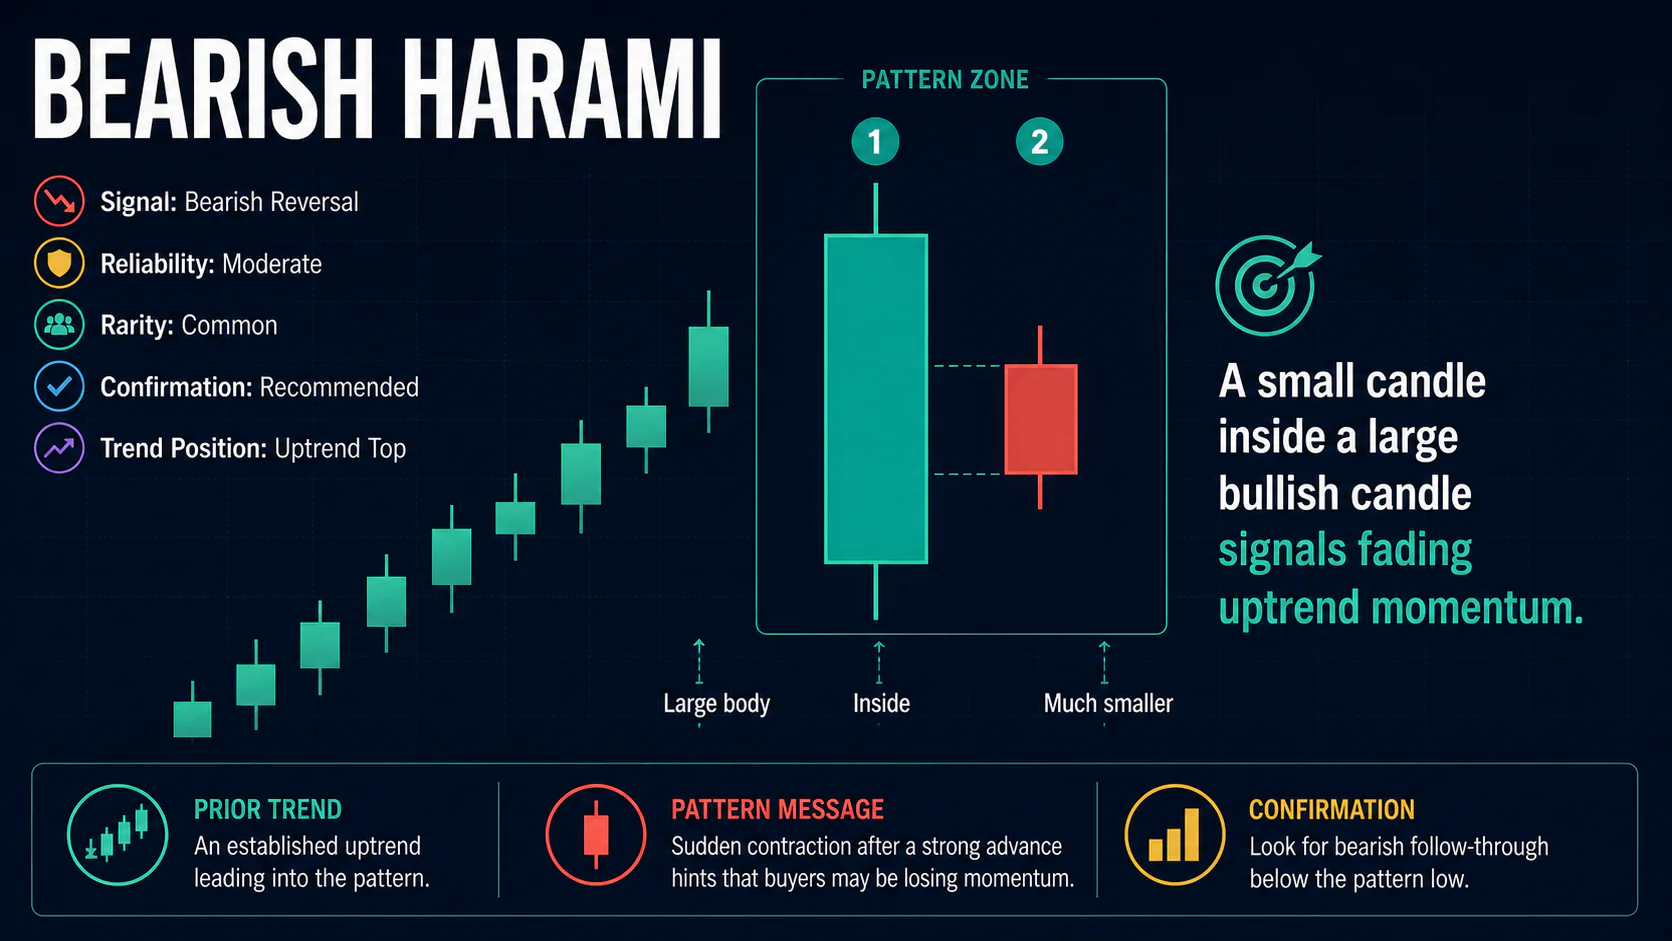
- First candle ("mother"): a large bullish candle with a substantial real body, representing strong buying and continuing the uptrend.
- Second candle ("baby"): a much smaller candle, of any color, whose entire real body — both open and close — falls inside the first candle's real body.
- Containment: only the real bodies need to be contained; the second candle's shadows may extend beyond the first candle's body without invalidating the pattern.
- Context: needs an established uptrend, and the size contrast between the two candles matters — the more dramatic the size drop, the more meaningful the exhaustion signal.
Volume that's elevated on the large first candle and noticeably lower on the small second candle supports the idea that a burst of buying was followed by a real loss of momentum, rather than just an ordinary quiet session.
A harami can form on any timeframe, but it's most often discussed on daily charts, where the size contrast between the two candles reflects a genuine shift in a full session's worth of trading rather than short-term noise. The same shape on a weekly chart, after a long and clearly established advance, generally carries more weight than an identical pattern intraday.
Market Psychology
The first candle reflects strong, possibly climactic, buying that pushes price sharply higher and reinforces the existing uptrend. The second candle's small range — contained entirely within the first — shows that buyers can no longer extend the move, and that the market has shifted from decisive conviction to indecision. That sudden loss of momentum right after an aggressive advance is what raises the possibility that the uptrend is due for a pause or reversal, though a harami on its own is a modest warning rather than confirmation that a top is in.
Variations
- Bearish harami cross: the second candle is a doji rather than just a small body, generally considered a somewhat stronger version of the pattern. Covered separately as the harami cross.
- Harami at resistance: the same two-candle shape forming at a known resistance level or major moving average adds independent technical weight to the containment signal.
- Volume-confirmed harami: a clear spike in volume on the first candle followed by a clear drop on the second, reinforcing the exhaustion narrative.
Trading the Harami
Entry: Because a harami is only a moderate, early-stage signal, most traders wait for the session after the pattern to open lower or close in the bottom half of its range before entering short.
Stop-loss: Above the high of the first (mother) candle is the standard, more conservative placement. A tighter stop just above the pattern's own high increases the chance of being stopped out but improves the risk-reward ratio.
Targets: The next meaningful support level below the pattern is the realistic near-term goal. A projection using the height of the first candle, measured down from the pattern's low, offers a rough minimum target.
Confirmation
Given the harami's moderate reliability on its own, confirmation matters more here than with stronger single-session patterns. A break below the pattern's low, ideally with a pickup in volume, or a failed retest of the first candle's high, both add meaningful conviction that the exhaustion the harami hinted at is turning into an actual decline.
Combining with Technical Indicators
The signal is more convincing alongside RSI above 70 with bearish divergence, a MACD histogram that's already losing steam, or an overbought stochastic reading. Formation at a major moving average or well-established resistance level adds further confluence. Weakening breadth or leadership in the broader market or the stock's sector around the same time is another useful piece of corroborating evidence, though none of these signals turns a moderate pattern into a guaranteed one.
Common Mistakes
- Accepting incomplete containment — the second candle's body must sit fully inside the first candle's body, not just mostly inside it.
- Ignoring size contrast — if the first candle isn't meaningfully larger than recent sessions, the exhaustion story behind the pattern doesn't really apply.
- Trading it without waiting for confirmation, given the pattern's only moderate reliability on its own.
- Setting overly ambitious profit targets that treat an early warning pattern as if it were a decisive reversal signal.
- Skipping the size-contrast check and calling any small candle inside a larger one a meaningful harami, regardless of context.
Where It Fits in a Trading Plan
Because a harami is only a moderate, early-warning signal, it fits best into a watchlist-style process rather than an immediate trading trigger. A practical approach is to note the pattern when it forms, define the level that would confirm it (a break of the pattern's low) and the level that would invalidate it (a new high above the first candle), and let subsequent price action decide whether to act. Sizing any resulting position so a stop at the invalidation level represents a small, planned loss helps keep a failed pattern from being costly, and reviewing how harami setups have performed on a given stock over time is a reasonable way to judge how much weight to give the pattern going forward.
FAQs
Does the second candle's color matter?
Not much. A bearish harami can have a bullish or bearish second candle — what matters is that its entire body is contained inside the first candle's larger body, not its color.
What's the bullish version of this pattern?
The mirror image, appearing after a downtrend — a large bearish candle followed by a small candle contained within it — is a bullish harami.
How is a harami different from an engulfing pattern?
They're structural opposites. In a harami, the second candle is small and sits inside the first. In a bearish engulfing pattern, the second candle is larger and swallows the first.
Is a harami a strong sell signal on its own?
No — it's generally treated as an early warning of possible exhaustion rather than a strong standalone reversal trigger, which is why confirmation matters more here than with some other patterns.
Do the shadows need to be contained too?
No, only the real bodies. The second candle's shadows can extend beyond the first candle's body without invalidating the pattern, though tighter containment is generally seen as a cleaner signal.
Can a harami appear more than once during the same uptrend?
Yes, and it often does — an uptrend can produce more than one harami before it actually reverses. That's part of why the pattern is treated as an early, moderate warning rather than a precise timing signal; each occurrence still needs its own confirmation.
Conclusion
The bearish harami captures a simple but useful idea: a sudden contraction in range right after a strong advance, suggesting buyers may be running out of conviction. Because it's only a moderately reliable, early-stage signal, it works best combined with resistance-level context, supporting indicators, and confirmation from the sessions that follow rather than being traded in isolation.