Bearish Engulfing
Updated Aug 26, 2026
- Signal
- Bearish Reversal
- Reliability
- High
- Rarity
- Common
- Confirmation
- Recommended
- Trend Position
- Uptrend Top
On this page
A bearish engulfing pattern is a two-candle reversal signal that can appear at the top of an uptrend. The first candle is a normal bullish candle continuing the trend; the second opens higher but reverses hard, closing below the first candle's open so that its real body completely covers, or "engulfs," the first candle's entire body. That complete reversal of the prior session's gain, inside a single session, is what gives the pattern its reputation as one of the more dependable two-candle bearish reversal signals — though, as with any candlestick pattern, confirmation still improves the odds.
Recognizing the Pattern
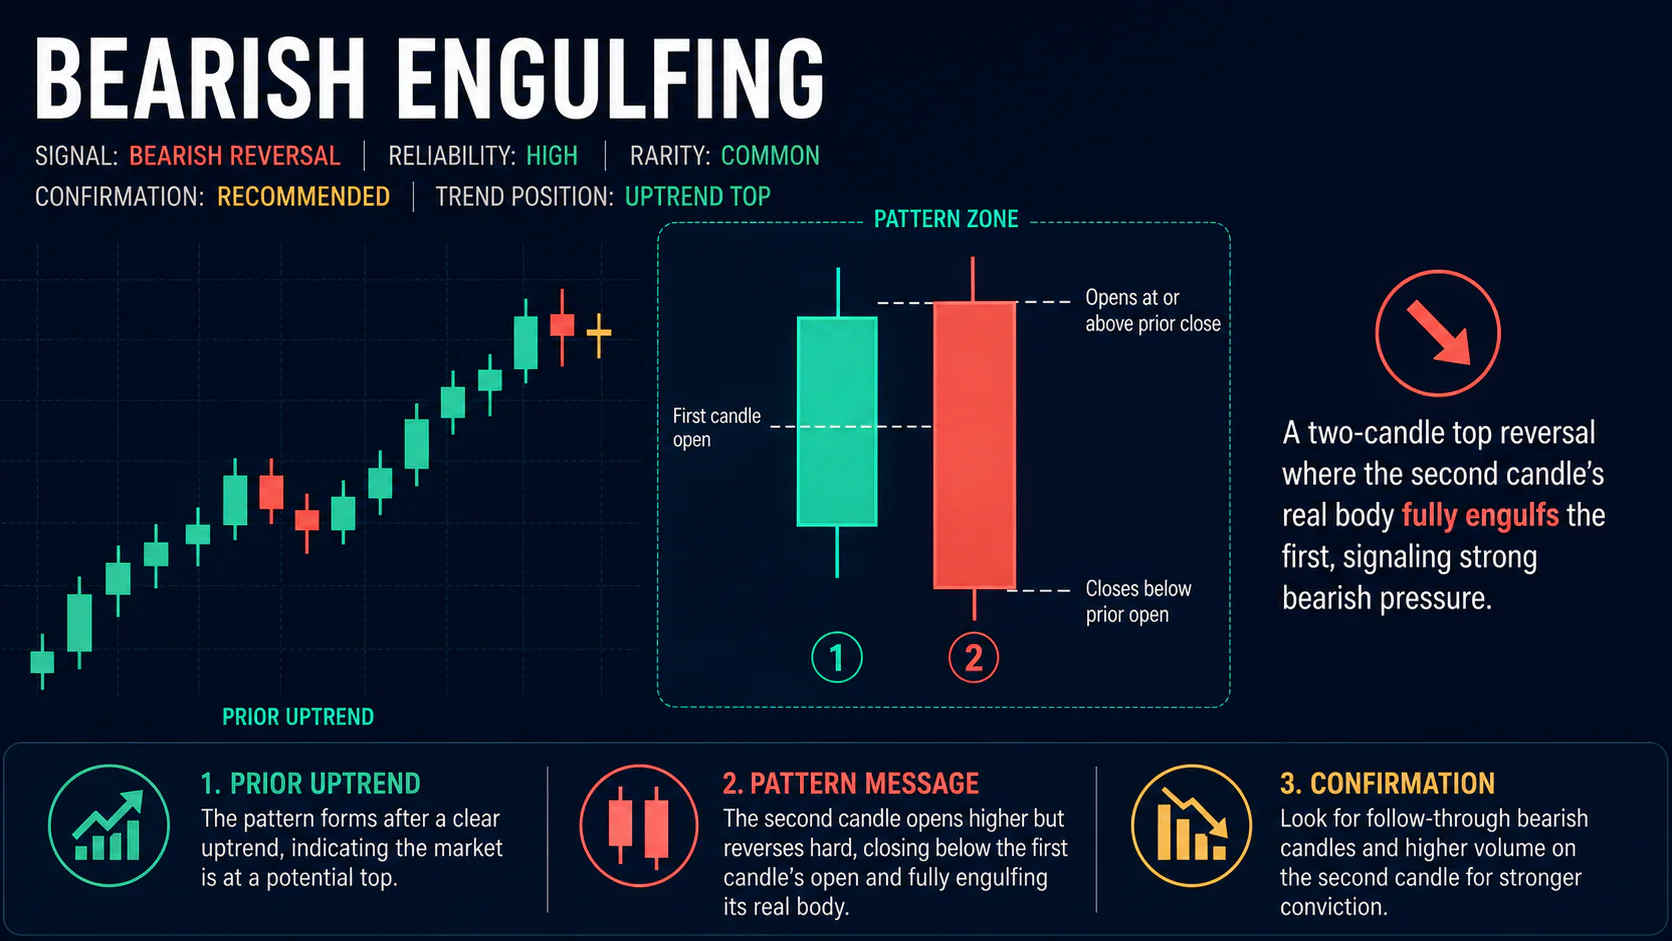
- First candle: a bullish (up) candle that continues the prevailing uptrend.
- Second candle: opens at or above the first candle's close, then reverses to close below the first candle's open.
- Engulfing requirement: the second candle's real body must fully contain the first candle's real body. Only the bodies matter for this test — the shadows don't need to be engulfed.
- Context: the pattern only carries reversal meaning after an established uptrend; the same two-candle shape in a sideways market or downtrend has no such implication.
A larger engulfing candle relative to the one it engulfs, and higher volume on that second candle, both add conviction. A gap up at the open of the second candle that then completely fails also adds to the psychological impact, though it isn't a strict requirement of the definition.
Engulfing patterns show up on any timeframe, from intraday charts to weekly charts, and the same logic applies at every scale: a candle that fully reverses the prior candle's body carries more meaning the longer that prior candle's session was. A daily engulfing pattern after a multi-week rally is generally read as more significant than the same shape appearing on a short intraday chart.
Market Psychology
The first candle shows buyers still in control, extending the uptrend with a normal, confident advance. The second candle opens higher still — often the session's point of maximum optimism — but sellers then take over completely, driving the close not just back to the open, but through it and below the prior session's own open. In one session, the entire prior gain is erased and then some. That decisive shift from buyer control to seller control, happening quickly enough to overwhelm an entire prior session's advance, is why the pattern reads as a strong reversal signal.
Variations
- Gap-up engulfing: the second candle opens with a clear gap above the first candle's close before reversing, adding to the psychological impact of the failed breakout.
- Multi-candle engulfing: the engulfing candle's body covers the combined bodies of several recent bullish candles rather than just one, suggesting more forceful selling.
- Engulfing at resistance: the same pattern forming exactly at a known resistance level, prior high, or major moving average carries additional weight from that independent technical confluence.
Trading the Engulfing Pattern
Entry: Some traders enter at the close of the engulfing candle itself, when volume and trend context support the reversal. More conservative traders wait for the next session to close below the engulfing candle's low for extra confirmation.
Stop-loss: Above the high of the engulfing candle, since a move back above that level undoes the pattern's premise.
Targets: Nearby support levels — prior lows, horizontal support, or a major moving average — are more realistic near-term objectives than aggressive projections. A downside measurement equal to the engulfing candle's own range, projected from its low, offers a reasonable minimum target.
Confirmation
Because the pattern already reflects a decisive one-session reversal, some traders treat a strong close on above-average volume as sufficient grounds to act. Others prefer to see the next session confirm with a lower close or a break of nearby support before entering. Either approach is reasonable; the key is picking one and being consistent about requiring volume or price follow-through rather than acting on a marginal, low-volume engulfing candle.
Combining with Technical Indicators
An engulfing pattern is more convincing when other signals point the same way: RSI above 70 with bearish divergence, a MACD histogram rolling over, or an overbought stochastic reading. Formation at a well-established resistance level or a major moving average adds further confluence. As always, indicator agreement improves the odds without guaranteeing the outcome.
Common Mistakes
- Accepting incomplete engulfment — the second candle's body must fully cover the first candle's body, not just overlap most of it.
- Ignoring trend context and trading the shape in a sideways market where it carries no reversal meaning.
- Treating a marginally larger second candle as equivalent to a decisively larger one — size and volume both matter for conviction.
- Setting unrealistic profit targets that ignore nearby support likely to slow the decline.
- Weighting every engulfing pattern equally regardless of trend length, size contrast, or proximity to resistance.
Where It Fits in a Trading Plan
Because a bearish engulfing pattern already represents a decisive one-session reversal, it's tempting to treat it as a complete trading signal on its own. In practice it works best alongside a plan that already accounts for where support and resistance sit, what the broader trend looks like on a higher timeframe, and how large a position makes sense given that any single pattern can fail. Sizing a trade so that a stop above the engulfing candle's high represents a small, acceptable loss — rather than a significant one — keeps the occasional failed pattern from being costly. Reviewing how engulfing setups have performed historically on a given instrument is also a reasonable way to judge how much weight to give the next one.
FAQs
Do the shadows need to be engulfed too?
No. Only the real bodies matter for a valid bearish engulfing pattern — the second candle's body must contain the first candle's body, but the wicks can extend beyond in either direction without invalidating the pattern.
What's the bullish version of this pattern called?
The mirror image — a bearish candle followed by a larger bullish candle that engulfs it, appearing after a downtrend — is a bullish engulfing pattern.
How is engulfing different from a harami?
They're opposites in structure. In engulfing, the second candle's body swallows the first. In a harami, it's reversed — a small second candle sits contained inside the first candle's larger body.
Does volume matter for this pattern?
Yes. Higher volume on the engulfing candle suggests broader participation in the reversal rather than a thinly traded move, and most traders treat it as meaningful supporting evidence, even though it isn't part of the strict definition.
Is a bearish engulfing pattern a guaranteed sell signal?
No single candlestick pattern is a guarantee. Bearish engulfing is generally regarded as one of the more reliable two-candle reversal signals, but it should still be weighed alongside trend context, support and resistance, and broader indicators.
Does the pattern work the same way on every timeframe?
The same logic applies at every scale, but a bearish engulfing pattern that forms on a daily or weekly chart after a genuine uptrend is generally viewed as more meaningful than the same shape on a short intraday chart, where price swings are noisier and less connected to a broader trend.
Conclusion
The bearish engulfing pattern captures a clean, visually obvious shift in control: a session that not only stops an uptrend but erases the entire prior session's gain in the process. It works best after an extended advance, at or near resistance, and with some combination of strong volume and follow-through confirmation. As with any reversal pattern, treat it as one part of a broader read on the chart rather than a signal to act on in isolation.