Bearish Long Legged Doji
Updated Aug 26, 2026
- Signal
- Bearish Reversal
- Reliability
- Moderate
- Rarity
- Common
- Confirmation
- Required
- Trend Position
- Uptrend Top
- Best Timeframes
- Daily+
On this page
A long-legged doji has a tiny real body with long shadows extending both above and below it — price swung significantly higher and lower during the session before closing almost exactly where it opened. Because the pattern is symmetrical, it doesn't have an inherent bullish or bearish bias on its own; its meaning comes from where it appears. After an extended uptrend, it's read as a warning that neither buyers nor sellers can hold control, often marking the point where upward momentum stalls.
Recognizing the Pattern
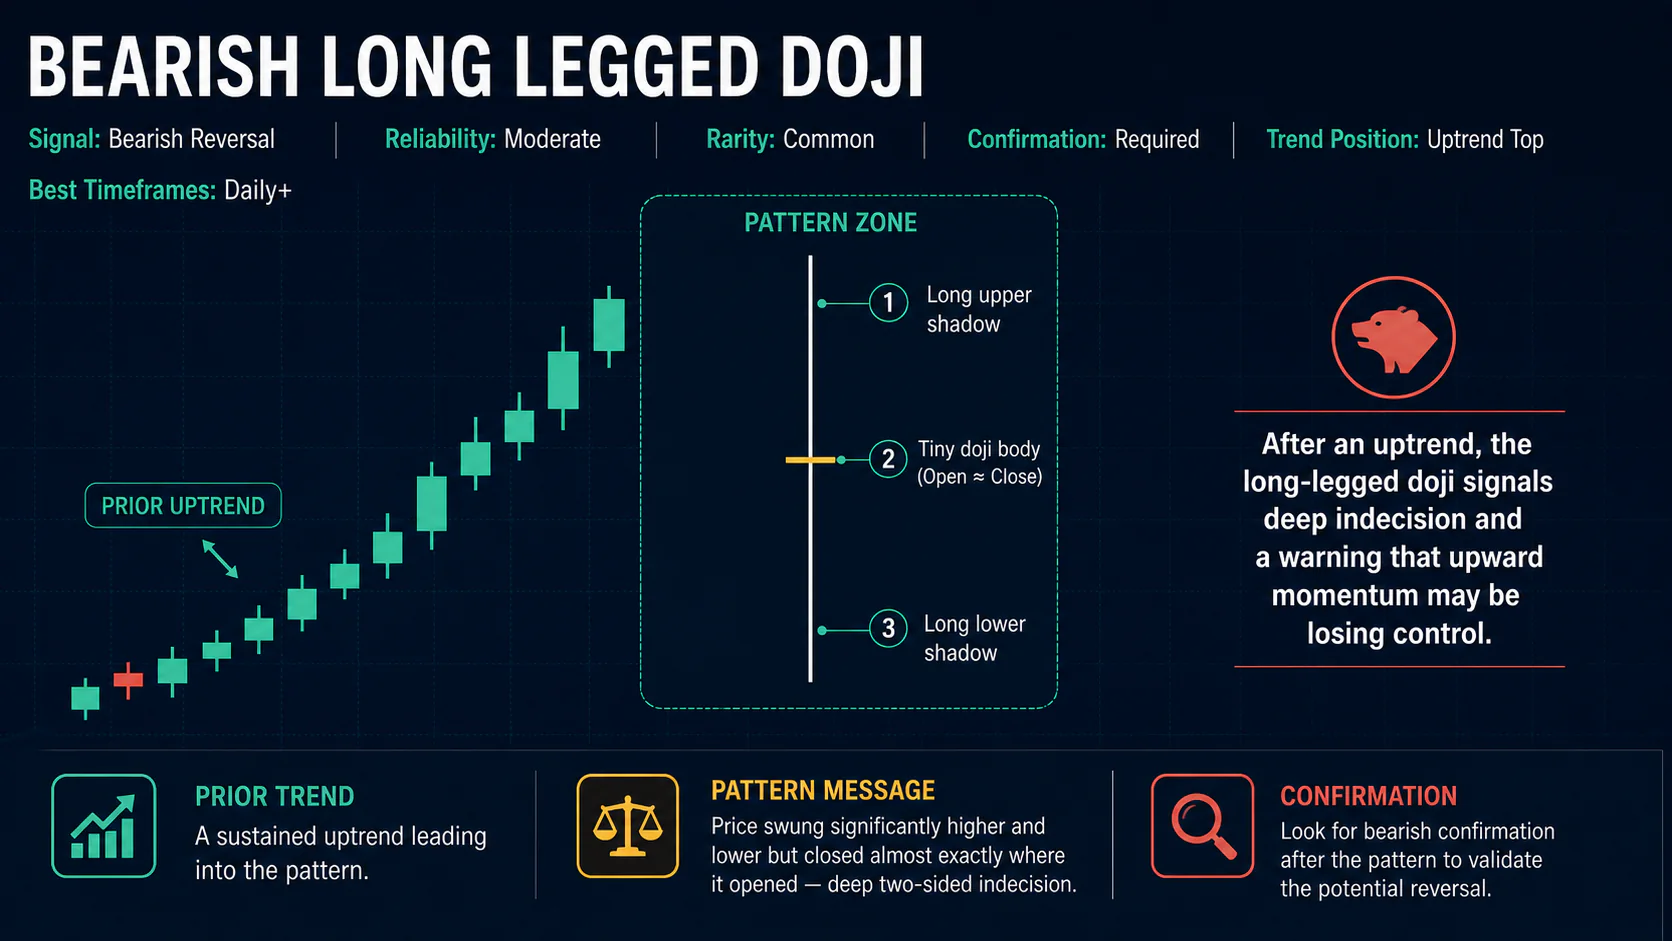
Doji body: Open and close are equal or virtually equal, leaving little to no visible body.
Long upper shadow: Price tested meaningfully higher than the open/close level before being rejected.
Long lower shadow: Price also tested meaningfully lower before recovering — ideally of comparable length to the upper shadow, underscoring genuine two-sided indecision.
Trend context: The bearish reading depends on the pattern appearing after a sustained uptrend, preferably near resistance or after overbought readings elsewhere; the same shape mid-range or in a downtrend carries different implications (see the bullish long-legged doji).
Market Psychology
Both sides tested their conviction hard during the session — bulls pushed price up, bears pushed it down — and neither could sustain control, leaving the close right back at the open. After a long advance, that kind of two-sided battle is often a sign that the trend has run out of one-directional energy, even though the session itself doesn't establish which side will win next. Because the pattern doesn't lean bullish or bearish structurally, it's weaker on its own than directional patterns like the gravestone doji, and leans more heavily on confirmation and context.
Variations
High wave doji: An especially pronounced version with unusually long shadows on both sides, reflecting an even wider trading range relative to the body.
Asymmetric long-legged doji: One shadow is noticeably longer than the other, which can hint at which side pushed harder during the session, though the doji's core message of indecision still applies.
Trading the Pattern
Entry
Because the pattern is directionally neutral by itself, don't enter on the doji alone. Wait for the next session to close below the doji's low, confirming that sellers have actually gained the upper hand.
Stop Loss
Place stops above the doji's high — a move back through that level suggests buyers have reasserted control and the bearish read has failed.
Profit Targets
Favor nearby support levels for initial targets. Given the pattern's inherent ambiguity, it's reasonable to take profits earlier here than with more decisive reversal candles.
Combining With Indicators
Because the candle itself doesn't argue strongly for either direction, supporting evidence matters more than usual. Overbought RSI or stochastic readings, a bearish MACD divergence, or the doji forming at a well-tested resistance level all help tip the balance toward the bearish interpretation.
Common Mistakes
- Treating the pattern as a strong bearish signal on its own, when its symmetry really just flags indecision.
- Trading it without an established uptrend behind it, where the "exhaustion" read doesn't apply.
- Confusing a small-bodied candle with modest shadows for a true long-legged doji, which requires genuinely long shadows on both sides.
- Skipping confirmation given how little directional information the candle provides by itself.
FAQs
Is a long-legged doji bullish or bearish?
Neither, inherently — it's a symmetrical indecision pattern. Its interpretation depends entirely on where it appears: after an uptrend it can warn of exhaustion, while after a downtrend it can suggest sellers are losing control instead.
How is it different from a regular doji?
A standard doji can have short or minimal shadows. A long-legged doji specifically requires long shadows on both sides, showing an unusually wide trading range for the session despite the doji close.
Should I trade this pattern by itself?
It's best used alongside trend context, resistance levels, and momentum indicators rather than as a standalone signal, given how little directional bias the shape carries on its own.
What confirms a bearish long-legged doji?
A subsequent session that closes below the doji's low, ideally with expanding volume, provides the follow-through that the doji itself can't.
Conclusion
A long-legged doji is a pure statement of indecision — its shadows show a genuine fight between buyers and sellers that ended in a draw. After a long uptrend, that draw can be an early signal that momentum is fading, but because the candle carries no inherent direction, it needs trend context, resistance, and confirmation to mean anything actionable.