Bearish Advance Block
Updated Aug 26, 2026
- Signal
- Bearish Reversal
- Reliability
- Moderate
- Rarity
- Common
- Confirmation
- Recommended
- Trend Position
- Uptrend Top
On this page
The Bearish Advance Block is a three-candle formation made up of three consecutive bullish candles that look, on the surface, like a healthy continuation of an uptrend. Underneath that surface, each candle has a progressively smaller real body and a progressively longer upper shadow than the one before it — a sign that buyers are struggling more each session to hold onto their gains. It's best treated as an early warning of a stalling advance rather than a confirmed reversal, which makes it more valuable as a reason to tighten risk management than as a standalone signal to go short.
Recognizing the Pattern
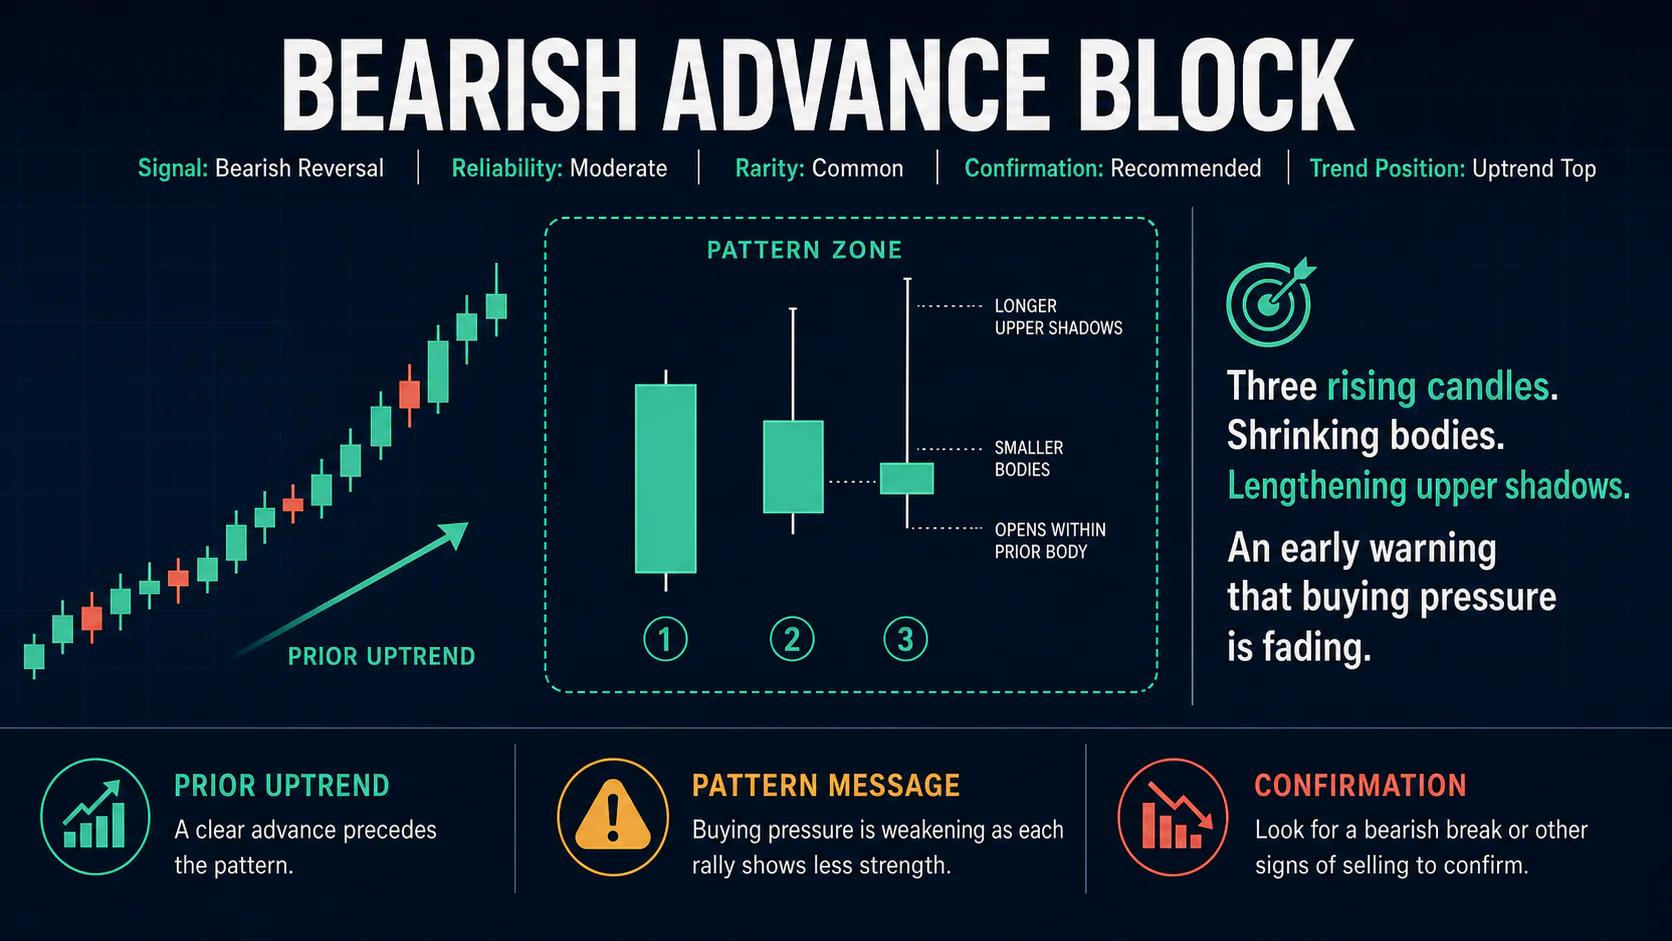
First candle: a strong bullish candle with a sizable body and little upper shadow, representing healthy buying pressure.
Second candle: bullish, opens within the first candle's body, but has a smaller real body and a longer upper shadow than the first — an early sign of hesitation.
Third candle: bullish, opens within the second candle's body, has the smallest body of the three, and shows the longest upper shadow, confirming that each session is finding more resistance on the way up.
All three candles must close higher than they opened, and each candle's body should be visibly smaller than the last, with upper shadows lengthening in step. It only carries meaning after a genuine uptrend — the same shrinking-body sequence in a sideways market is just noise. Falling volume through the three sessions reinforces the idea that buying interest is genuinely fading rather than just consolidating.
Quick Recognition Checklist
- Extended uptrend precedes the three-candle sequence
- All three candles close higher than they open
- Each candle's real body is smaller than the one before it
- Each candle's upper shadow is longer than the one before it
- Each candle opens within the prior candle's body
- Falling volume through the sequence adds confidence
Notable Variations
A version where the upper shadows become exceptionally long on the second and third candles — clearly rejecting the day's highs — tends to be a more convincing warning than one with only modest shadow growth. Formation at a well-tested resistance level or a round number adds a structural reason for the stall on top of the candle-by-candle deterioration.
Market Psychology
The pattern captures a slow-motion loss of conviction that plays out gradually enough to fool traders focused only on the fact that price is still rising.
First Candle: Business as Usual
- A normal continuation of the trend with healthy buying pressure
- Little upper shadow suggests the session closed near its strongest point
Second Candle: First Hint of Trouble
- Price still closes higher, but the session struggles more to get there
- Part of the intraday gain is rejected, leaving a longer upper shadow
Third Candle: The Deterioration Becomes Explicit
- The smallest net gain of the three sessions
- The most significant rejection at the highs
Prices are still going up, but the effort required to make each new high is increasing while the payoff is shrinking, which is exactly the kind of divergence between price and momentum that tends to precede a top.
Trading the Pattern
Entry
Because the pattern is a warning sign rather than a confirmed reversal, most traders wait for a subsequent close below the third candle's low before entering short, since that is the point where the deterioration finally shows up in price rather than just in candle structure.
Stop-Loss
A stop above the highest point of the three-candle sequence is the standard placement; more aggressive traders use the third candle's high instead, accepting a tighter but noisier stop.
Profit Targets
Targets typically focus on the nearest support level below the pattern, or a projection of the pattern's overall height measured downward from the breakdown point. Given the pattern's role as an early-warning signal rather than a high-conviction reversal, partial profit-taking at the first support level is a sensible default.
Confirmation and Indicator Confluence
The pattern is more convincing when RSI shows bearish divergence — new price highs accompanied by lower RSI highs — during the three-candle formation, or when a MACD histogram shows shrinking positive values even as price keeps rising. Formation at a well-known resistance level or major moving average adds further weight.
Sector and market context help round out the picture. An Advance Block that forms while similar stocks are also showing signs of fatigue, or while overall market breadth is narrowing, is a more trustworthy warning than the same pattern appearing in an isolated stock during an otherwise broad, healthy rally.
Common Mistakes
- Treating the pattern as a confirmed reversal and shorting immediately, rather than waiting for a break of the third candle's low.
- Missing the pattern because all three candles are bullish and the price is still making new highs.
- Ignoring irregular body-size progression — if the second or third candle isn't meaningfully smaller than the one before it, the pattern isn't fully formed.
- Trading the pattern without an extended uptrend behind it.
- Overweighting the signal — this is an early-warning pattern, not a high-reliability standalone reversal trigger.
- Ignoring volume — rising, rather than falling, volume through the sequence weakens the fading-momentum thesis considerably.
FAQs
Does the Advance Block mean the uptrend is over?
Not by itself. It's a warning that buying momentum is fading, not a confirmed top — traders generally wait for a break below the third candle's low before acting.
How is this different from Three White Soldiers?
The Three White Soldiers pattern is the bullish counterpart, with three roughly equal, strong-bodied candles and small shadows — a sign of healthy continued strength. Advance Block shows the opposite: shrinking bodies and growing upper shadows, signaling weakening momentum despite still-rising closes.
What if volume doesn't decline through the pattern?
Declining volume supports the fading-momentum thesis but isn't strictly required; the shrinking bodies and lengthening shadows are the core signal.
Can this pattern appear mid-trend rather than at a top?
It can, but it only carries reversal significance after a reasonably extended uptrend; the same shape appearing early in a fresh trend is far less meaningful.
What invalidates the pattern?
A subsequent strong bullish candle that closes above the pattern's highs with expanding volume suggests buyers have reasserted control and the warning has passed.
Is this a reliable enough signal to trade on its own?
Most traders treat it as a caution flag rather than a standalone trade trigger — useful for tightening stops on existing long positions or watching more closely for a confirmed breakdown, rather than shorting the moment the third candle closes.
Conclusion
The Bearish Advance Block rewards traders who look past the surface-level bullishness of three consecutive up candles and notice the shrinking bodies and growing upper shadows underneath. Because it's an early warning rather than a confirmed reversal, it works best combined with a break of the pattern's low or supporting momentum indicators before committing to a trade, and it is often more useful as a signal to manage existing positions defensively than as a fresh short entry on its own.