Bearish Three Inside Down
Updated Aug 26, 2026
- Signal
- Bearish Reversal
- Reliability
- Moderate
- Rarity
- Common
- Confirmation
- Recommended
- Trend Position
- Uptrend Top
On this page
The Bearish Three Inside Down is a three-candle reversal pattern that forms at the top of an uptrend. It combines a bearish harami — a small down candle tucked inside the prior up candle's real body — with a third candle that closes below the first candle's low, confirming that sellers have taken control. Because it needs this extra confirming candle, traders treat it as a moderately reliable, fairly common signal rather than an automatic reversal trigger, and it shows up often enough on daily charts that most swing traders will encounter it regularly.
Recognizing the Pattern
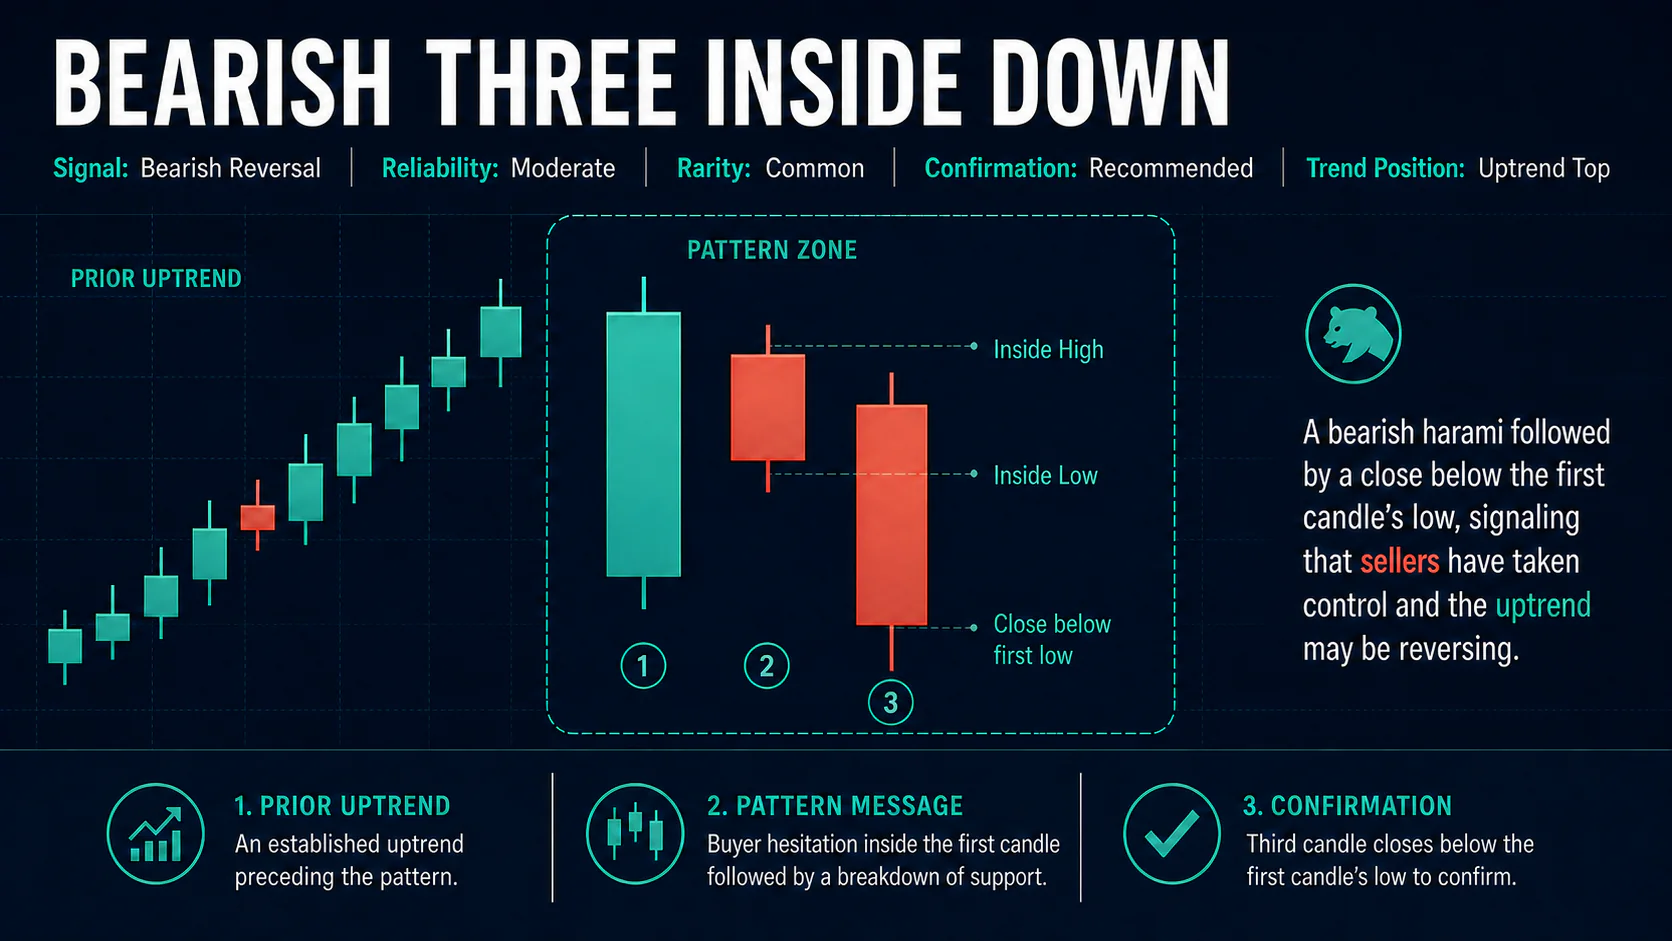
First candle: a strong bullish candle that extends the existing uptrend, with a sizable real body and minimal shadows.
Second candle: a bearish candle whose entire real body is contained within the first candle's real body — a classic harami. This inside day signals the first hesitation among buyers.
Third candle: a bearish candle that closes below the low of the first candle. This is the confirmation step — without it, the pattern is just an unconfirmed harami, not a completed Three Inside Down.
For the pattern to carry reversal significance, it needs a genuine prior uptrend, a harami that is fully contained (both the second candle's high and low inside the first candle's range), and a third candle that decisively breaks the first candle's low rather than merely drifting lower. Volume that builds from the first candle's hesitation through the third candle's breakdown adds confidence but is not part of the formal definition.
Quick Recognition Checklist
- An established uptrend precedes the pattern
- First candle is a strong bullish candle with a sizable real body
- Second candle's entire real body sits inside the first candle's real body (harami)
- Third candle is bearish and closes below the first candle's low
- Volume ideally builds from the second candle's hesitation into the third candle's breakdown
- Formation near resistance, a round number, or a major moving average adds weight
Notable Variations
A third candle that gaps below the first candle's low before closing lower still is the most convincing version, since it shows urgency rather than a grinding decline. A very small, tight harami — where the second candle barely has a body — tends to mark sharper indecision and can precede a faster move once the third candle confirms.
Patterns that complete exactly at a well-tested resistance level or a round number carry more weight than the same three candles forming in the middle of an otherwise unremarkable range, since the rejection has an obvious technical reason behind it rather than appearing in a vacuum.
Market Psychology
The pattern tells a three-session story of eroding conviction, moving from bullish control through hesitation to a decisive handoff of power.
First Candle: Bulls in Control
- Buyers push price higher with real conviction, often on above-average volume
- Momentum indicators can reach overbought territory during this session
Second Candle: The First Crack
- Bulls can no longer extend the range; the session stays fully inside the prior day's action
- Volume often eases as buying conviction fades
- The inside-day structure reflects genuine indecision rather than outright selling
Third Candle: Sellers Take Over
- The break below the first candle's low triggers stops from late longs
- Volume often expands as the decline gathers participants
- The balance of power has visibly shifted from buyers to sellers
Trading the Pattern
Entry
Most traders wait for the third candle's close below the first candle's low before acting, since entering on the harami alone skips the pattern's confirmation step entirely. A break of the third candle's low on the following session offers a more conservative entry for traders who want additional proof the decline is continuing, at the cost of a slightly worse average price.
Stop-Loss
A logical stop sits above the first candle's high — a move back above that level invalidates the reversal thesis outright. More aggressive traders use the second candle's high instead, accepting a tighter stop and a higher chance of being shaken out by ordinary volatility before the move develops.
Profit Targets
Reasonable profit objectives include the next support level below the pattern, or a projection of the first candle's high-to-third-candle's-low distance measured downward from the breakdown point. Scaling out partial profits at the first support level while letting the remainder run is a sensible way to manage a pattern with moderate, rather than exceptional, reliability.
Confirmation and Indicator Confluence
The pattern is more convincing when it forms near established resistance, a round number, or a major moving average, and when momentum indicators are already stretched. An RSI reading above 70 that starts turning down during the pattern, or a MACD line crossing below its signal line, both support the idea that the preceding advance was running out of steam before the harami even appeared.
Broader context matters too: formation at a prior swing high, a long-term trendline, or a major moving average such as the 50-day or 200-day line adds a structural reason for the reversal beyond the candles themselves. A stock or sector already showing relative weakness compared to the broader market lends further support to a bearish read, though none of this is required — it is corroborating evidence, not a substitute for the pattern's own structure.
Common Mistakes
- Trading the harami before the third candle confirms — the pattern isn't complete until the close below the first candle's low.
- Accepting a harami where the second candle's high or low pokes outside the first candle's range.
- Ignoring trend context — the same three candles inside a downtrend or a sideways range don't carry reversal meaning.
- Placing stops so tight that ordinary volatility triggers them before the trade has a chance to work.
- Sizing the position as if the pattern were a high-reliability signal rather than a moderate one.
- Overlooking volume — a third candle on light volume is a weaker signal than one accompanied by a clear pickup in participation.
- Chasing the pattern far from any resistance or technical level, where the reversal has less of a structural foundation.
FAQs
Is the Bearish Three Inside Down the same as a bearish harami?
No. The harami is only the first two candles. The Three Inside Down adds a third candle that must close below the first candle's low; without that confirmation, it's an unconfirmed harami, not a completed pattern.
Do I need volume confirmation for this pattern to work?
Volume isn't part of the formal definition, but a rising level of activity into the third candle's decline is a useful supporting signal, and thin volume throughout is a reason for extra caution.
What invalidates the pattern after it forms?
A subsequent close back above the first candle's high suggests the reversal has failed and buyers have reasserted control.
How does this differ from a Three Outside Down?
Three Inside Down starts with a harami (second candle contained inside the first). The Three Outside Down starts with a bearish engulfing candle (second candle's body swallows the first's). Both are confirmed by a third bearish candle.
Can this pattern appear inside a downtrend?
It can look identical visually, but it has no reversal significance there. A Three Inside Down only signals a bearish reversal when it follows a genuine uptrend.
Does the pattern work on any timeframe?
It appears on any timeframe, but like most candlestick patterns it carries more weight on daily and weekly charts than on short intraday bars, where noise produces more false signals.
Conclusion
The Bearish Three Inside Down gives traders a structured way to watch an uptrend lose momentum: a harami signals hesitation, and a confirming close below the first candle's low turns that hesitation into an actionable reversal signal. Its moderate reliability and reasonably common occurrence make it a useful addition to a reversal-trading toolkit, provided traders wait for the confirming third candle, respect the first candle's high as an invalidation level, and size positions accordingly.