Bearish Downside Tasuki Gap
Updated Aug 26, 2026
- Signal
- Bearish Continuation
- Reliability
- Moderate
- Rarity
- Rare
- Confirmation
- Recommended
- Trend Position
- Mid-Trend
On this page
The downside tasuki gap is a three-candle continuation pattern that appears during a downtrend. Two black candles create a gap lower, and a third, white candle opens inside the second candle's body and rallies partway back into the gap without closing it completely. Because the gap stays open, it continues to act as resistance, and the pattern is read as a sign the decline is likely to resume.
Recognizing the Pattern
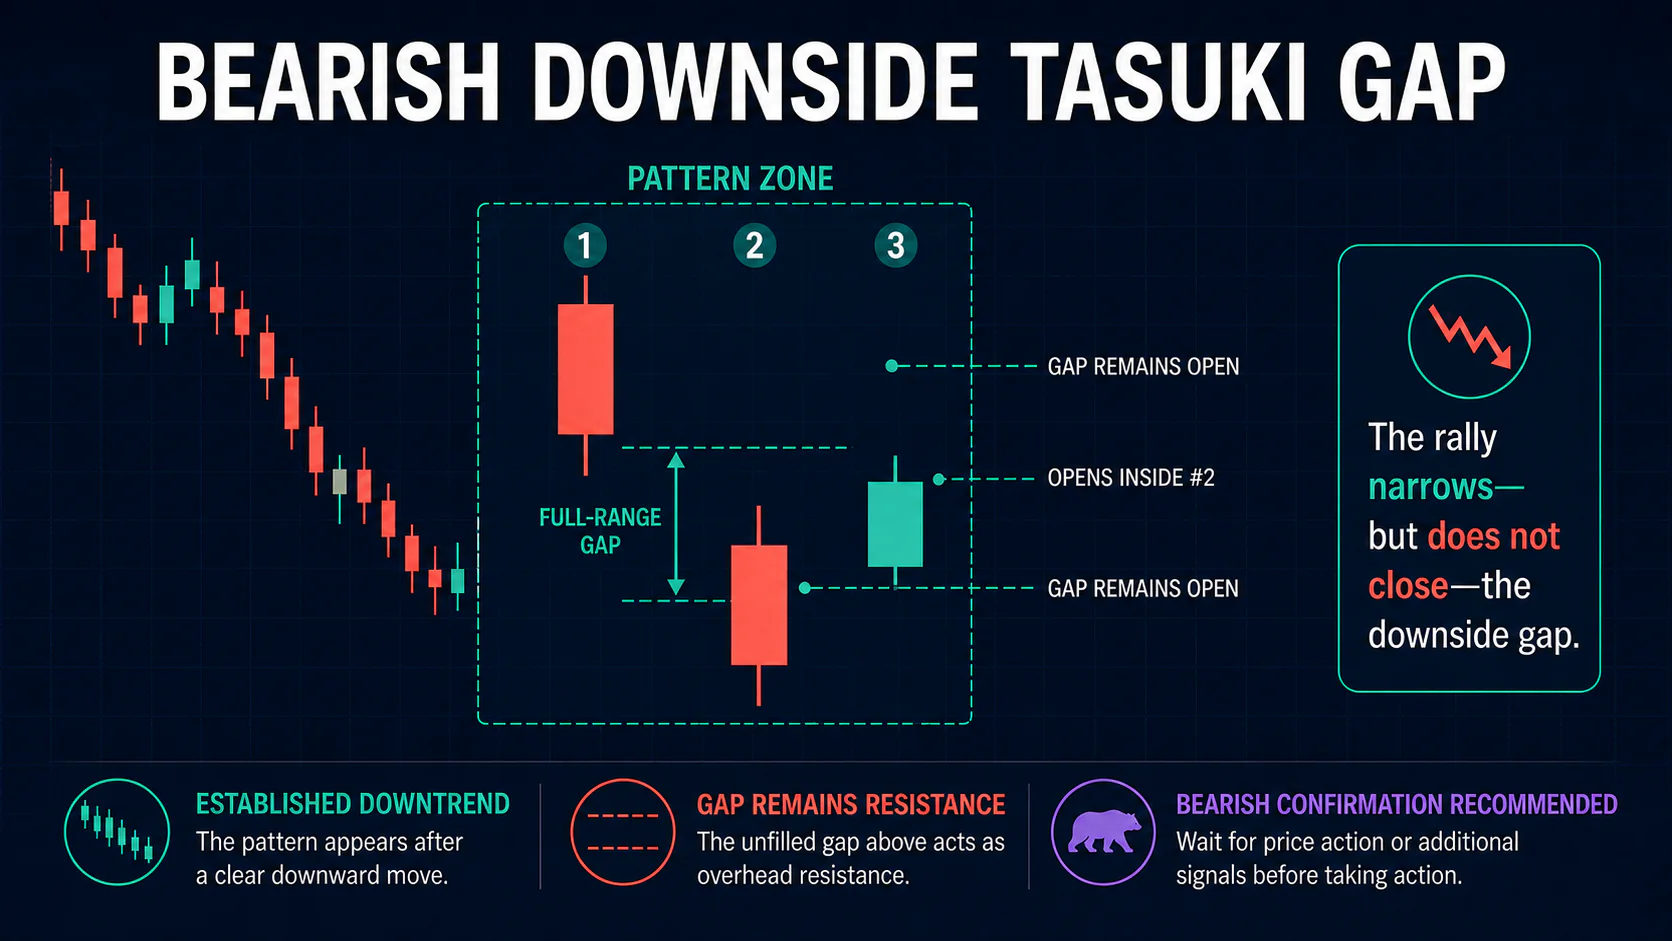
First candle: a black candle that continues an existing downtrend.
Second candle: another black candle that gaps down from the first, leaving a visible gap between the first candle's low and the second candle's high. This candle extends the decline.
Third candle: a white candle that opens within the second candle's body, then rallies. Its close lands inside the gap - above the second candle's open but below the first candle's close - so the gap narrows but does not close. If the third candle closed the gap completely, the pattern would be negated.
The pattern only has meaning inside an established downtrend; the same three candles in a sideways market carry no continuation significance. Each candle should have a real, decisive body rather than a doji or spinning top, since indecisive candles undercut the pattern's message.
Market Psychology
The first two black candles show sellers firmly in control, and the gap between them signals the decline is accelerating rather than pausing. The third candle's rally shows some buyers stepping in - short covering or bargain hunting - but their inability to close the gap shows this buying is not strong enough to challenge the trend. The gap keeps acting as resistance because it marks the level where sellers were previously in full control, and a rally back to that level typically attracts renewed selling. Traders who bought the third candle expecting a genuine reversal are often the first to sell once the rally stalls, which can add fuel to the next leg down.
Variations
Support-turned-resistance version: when the gap forms just below a recently broken support level, that level reinforces the gap as resistance, adding confluence to the setup.
Extended gap: occasionally the gap stays open for more than one session before the confirming white candle appears. The underlying logic is unchanged - confirmation still depends on the rally failing to close the gap, regardless of timing.
Shallow-fill version: the third candle sometimes barely enters the gap at all, closing only just above the second candle's open. This is a weaker but still valid form of the pattern, since any failure to close the gap keeps the continuation read intact.
Beyond these, most differences between examples of this pattern come down to gap size or volume rather than distinct pattern types. The core structure - two gapped black candles and a white candle that fails to close the gap - is what defines the setup.
Trading the Pattern
Entry: once the third candle closes without filling the gap, a short entry aligns with the resumed downtrend. More conservative traders wait for the next session to confirm continued weakness, such as a lower close or a fresh push below the pattern's low.
Stop-loss: place stops above the top of the gap (the first candle's close), since a full gap fill invalidates the bearish read. Some traders use the third candle's high instead for a tighter stop.
Targets: a common approach projects the size of the gap downward from the breakdown point, then looks to nearby support - prior lows, round numbers, or moving averages - for more ambitious targets.
Confirmation
Because the pattern only shows a failed fill rather than an outright breakdown, many traders wait one more session before acting. A next session that opens lower or pushes to a fresh low reinforces the setup, while one that grinds further into the gap should be treated as a warning that the "failure" may have just been a pause. Look for the third candle's rally to have occurred on lighter volume than the two black candles that preceded it, since light volume during the bounce suggests weak buying conviction.
Combining with Indicators
Momentum indicators such as RSI or the MACD staying in bearish territory through the pattern add confidence, and a moving average sitting just above the gap can reinforce it as resistance. For a related gap-based continuation setup, see the downside gap three methods.
Common Mistakes
Traders sometimes accept a small overlap between the first and second candles as "close enough" to a gap - it isn't, and a genuine price void is part of the definition. Others enter before the third candle closes, missing the confirmation that the rally actually failed to close the gap. It also pays to check that the pattern appears within a real downtrend rather than a sideways range, and to size positions conservatively given the pattern's moderate reliability and relative rarity.
FAQs
Is the downside tasuki gap bullish or bearish?
It is bearish. It signals that a downtrend is likely to continue after a brief upward pause.
What happens if the third candle closes the gap completely?
The pattern is invalidated. A full gap fill removes the resistance the pattern depends on and shifts the near-term outlook toward a possible reversal instead of continuation.
How is this different from bearish falling three methods?
Falling three methods also confirms downtrend continuation, but it uses small consolidating candles contained within the range of a long black candle rather than a gap between two black candles. See bearish falling three methods for the comparison.
Does volume matter for this pattern?
Yes, qualitatively. Heavier volume on the two black candles and lighter volume on the third candle's rally both support the bearish interpretation, though there is no fixed volume threshold that defines the pattern.
How rare is this pattern?
It is one of the less common continuation patterns, since it requires a clean gap between two black candles followed by a controlled partial retracement - a specific sequence that does not appear often.
Can this pattern appear in an uptrend?
The same three-candle shape can technically occur, but it would not carry continuation meaning without a prior downtrend - the pattern's signal depends entirely on that context.
Conclusion
The downside tasuki gap is a useful confirmation tool for traders already positioned with a downtrend: it shows a bounce attempt failing to erase a bearish gap, keeping the path of least resistance to the downside. Like any single pattern, it works best alongside broader trend context and basic confirmation rather than in isolation.