Bearish Tri Star
Updated Aug 26, 2026
- Signal
- Bearish Reversal
- Reliability
- High
- Rarity
- Extremely Rare
- Confirmation
- Required
- Trend Position
- Uptrend Top
- Best Timeframes
- Daily+
On this page
A bearish tri star is a rare three-candle pattern made up of three consecutive dojis, with the middle doji gapping above the other two. Because true dojis are already uncommon and three of them appearing in a row is far more so, the pattern is one of the least frequently seen candlestick reversals — but when it does appear after a sustained uptrend, most technical analysts treat it as a serious warning of exhaustion.
Recognizing the Pattern
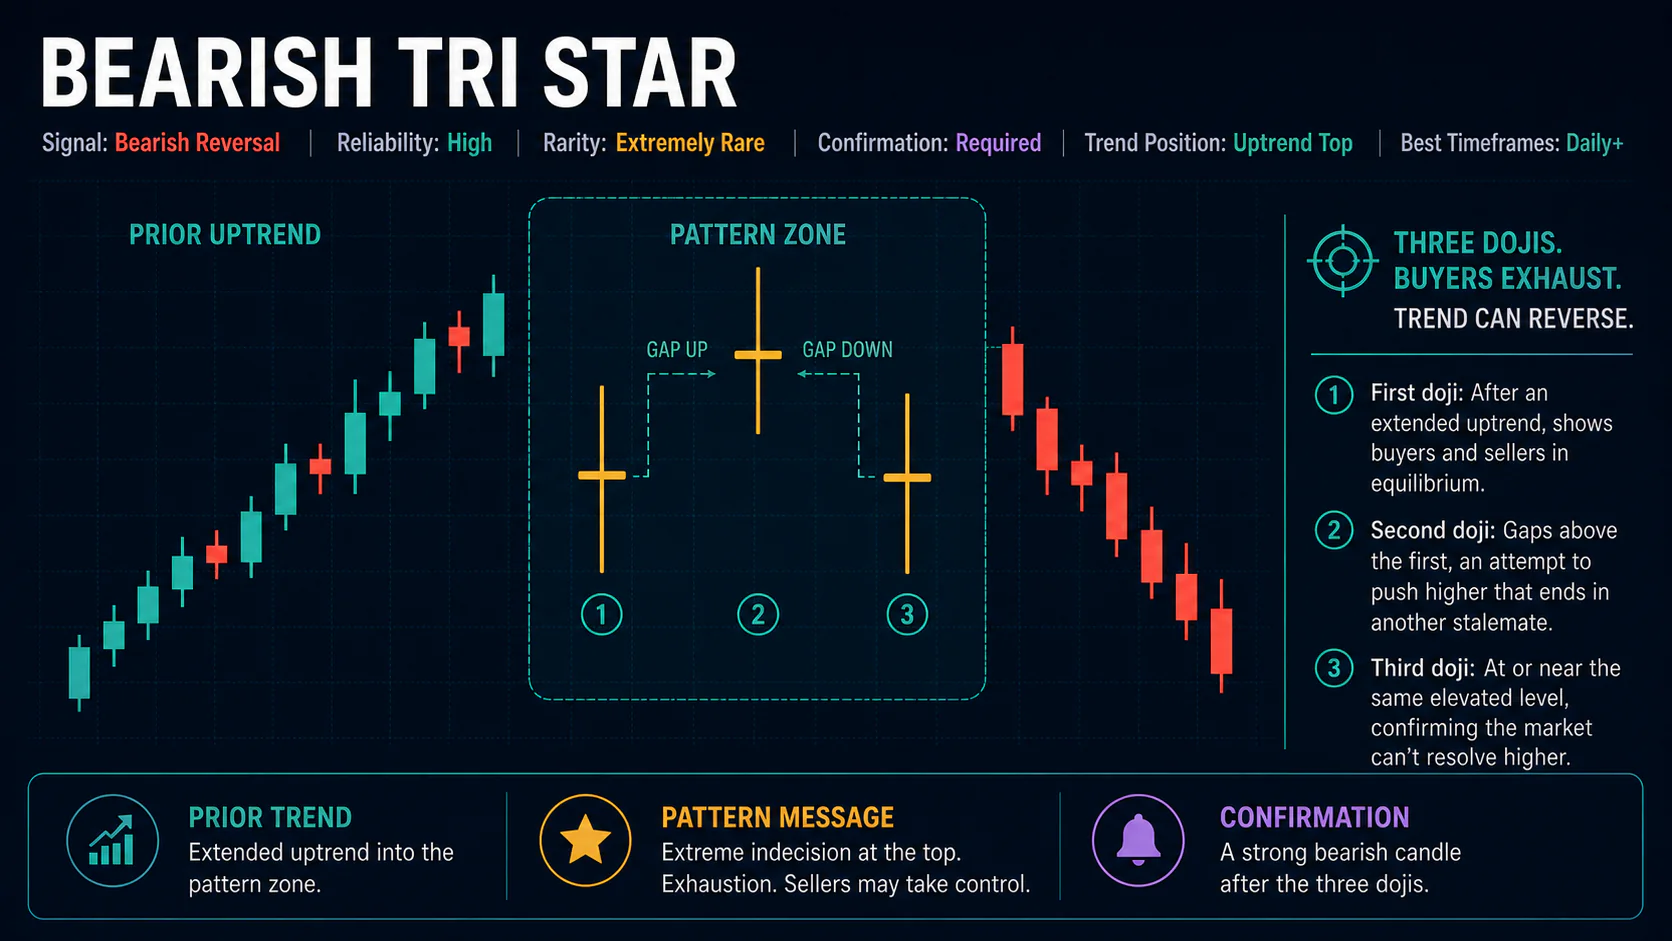
First doji: Appears after an extended uptrend, showing the first sign that buyers and sellers have reached equilibrium.
Second doji: Gaps above the first doji, showing that despite the earlier indecision, an attempt was made to push higher — an attempt that itself ended in another stalemate.
Third doji: Completes the sequence, typically at or near the same elevated level as the second, reinforcing that the market can't resolve the standoff in the buyers' favor.
Each candle must be a genuine doji — open and close essentially equal — and the three must appear in direct succession with no other candle types breaking up the sequence.
Market Psychology
One doji after a long advance is a minor caution sign. Three in a row is a far stronger statement: buyers keep attempting to extend the trend, reflected in the gaps up to the second and third dojis, but are unable to close out any of those sessions with an actual gain. That repeated failure, despite maintained elevation, suggests demand at these levels is thinning out even though sellers haven't yet forced prices down. The pattern's rarity is itself part of why technicians pay attention to it — this specific standoff doesn't happen often, so when it does, it tends to draw notice.
Trading the Pattern
Entry
Wait for the session following the third doji to close decisively below all three lows, ideally with a gap down, before entering short.
Stop Loss
Place stops above the highest point of the three-doji formation — a move back above that level fully invalidates the bearish read.
Profit Targets
Nearby support levels are the most defensible targets. Because the pattern is rare enough that there isn't a large body of trading history to draw firm projections from, keep target-setting conservative and let subsequent price action guide extensions.
Combining With Indicators
The case strengthens when the tri star forms at a well-established resistance level and coincides with overbought readings on RSI or stochastics, or a bearish MACD divergence already in progress. Given how uncommon the pattern is on its own, this kind of confluence is worth actively looking for before committing capital.
Common Mistakes
- Acting after only two dojis appear, before the third completes the pattern.
- Accepting small-bodied candles that aren't genuine dojis, which undermines the statistical rarity that gives the pattern its weight.
- Trading the pattern without a real uptrend behind it.
- Assuming rarity alone guarantees a large payoff — the pattern still requires confirmation and proper stop placement like any other setup.
FAQs
Why is the bearish tri star considered rare?
It requires three consecutive genuine dojis, a formation that doesn't occur often even in choppy markets. Most uptrends resolve one way or another well before three straight sessions end in a dead heat.
Do the three dojis need to gap higher each time?
The classic form has the second doji gapping above the first, with the third holding near that same elevated level. Some real-world examples are less perfectly staggered, but the consecutive-doji requirement itself shouldn't be relaxed.
Is confirmation still necessary given how rare the pattern is?
Yes. Rarity supports the case that something unusual is happening, but it doesn't replace the need to see sellers actually break the pattern's low before acting.
What's the bullish version of this pattern?
The bullish tri star, the same three-doji structure appearing after a downtrend instead.
Conclusion
The bearish tri star's significance comes from how unusual it is to see three consecutive dojis at all, combined with the clear message that buyers can't resolve the standoff in their favor. Treat it as a genuine warning when it appears in the right context, but still wait for confirmation before trading it — rarity makes a pattern notable, not automatically actionable.