Bearish Evening Doji Star
Updated Aug 26, 2026
- Signal
- Bearish Reversal
- Reliability
- High
- Rarity
- Rare
- Confirmation
- Required
- Trend Position
- Uptrend Top
On this page
A bearish evening doji star is a three-candle reversal pattern — a variant of the evening star — that can appear at the top of an uptrend. The first candle is a strong bullish candle; the second is a doji that gaps to a new high, showing a moment of complete balance between buyers and sellers; the third is a strong bearish candle that closes well back into the first candle's body. Because a true doji represents a sharper break in momentum than an ordinary small-bodied star, this variant is generally regarded as a somewhat stronger reversal signal than the plain evening star, though it also occurs less often.
Recognizing the Pattern
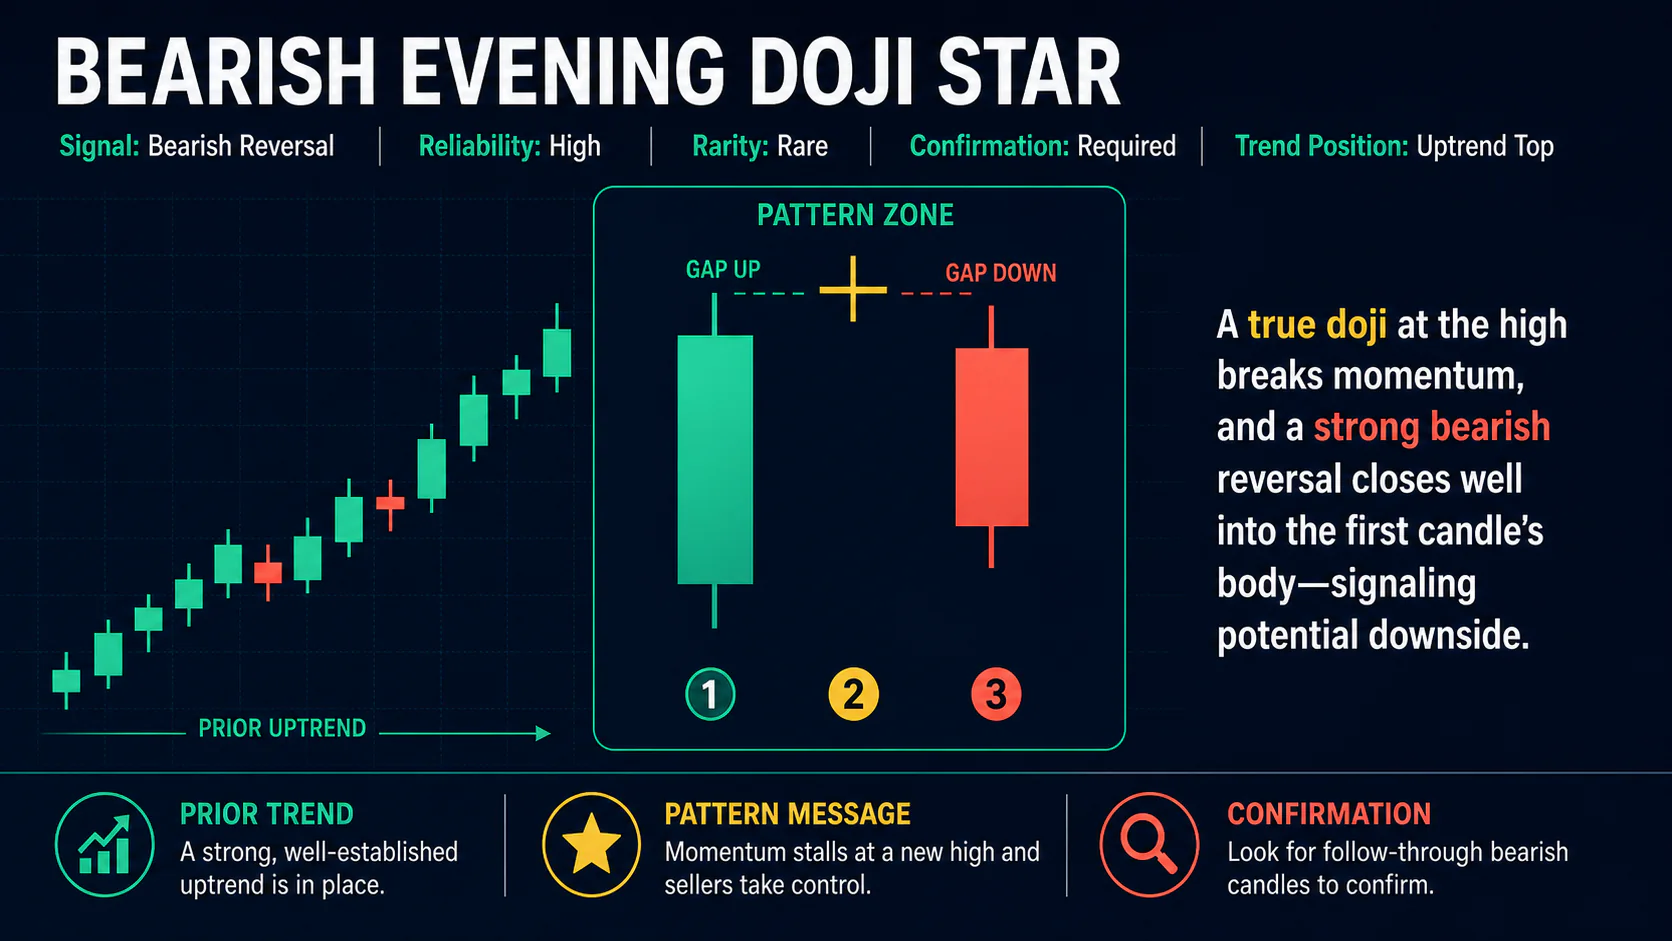
- First candle: a strong bullish candle with a substantial real body, continuing an established uptrend.
- Second candle (the doji): opens and closes at virtually the same price after gapping above the first candle's high, reflecting a genuine standoff between buyers and sellers rather than just a small-bodied candle.
- Third candle: a strong bearish candle that closes well into the first candle's real body, ideally at least halfway.
- Context: needs a real, extended uptrend beforehand.
Gaps on both sides of the doji — separating it from the first candle and from the third — sharpen the pattern's visual clarity and are considered ideal, though not strictly mandatory in every market. The key distinguishing feature versus a plain evening star is the quality of the middle candle: it must be a genuine doji, with the open and close essentially equal, not merely a small real body.
Like other multi-candle patterns, the evening doji star can appear on any timeframe, though it's most often referenced on daily charts, where each candle reflects a full session's tug-of-war between buyers and sellers. A true doji following a long, well-established advance on a weekly chart generally carries more weight than the same shape on a short intraday chart, where a flat close is a fairly routine, low-information occurrence.
Market Psychology
The first candle shows buyers firmly in control. The doji that follows, despite opening at a new high, ends the session exactly where it began — a rare and visually striking sign that buying and selling pressure have reached a genuine standstill at the top of the move. The third candle then resolves that standoff in favor of sellers, closing back deep into the first candle's gains. The progression from conviction, to perfect equilibrium, to reversal is what gives this variant its reputation as a particularly clear reversal signal, even though true doji formations don't appear as often as ordinary small-bodied stars.
Variations
- Abandoned baby variant: both gaps — before and after the doji — remain completely open, with no overlap between the doji's range and either neighboring candle's range. Considered an especially strong, if rare, form of the pattern.
- Evening doji star at resistance: the same three-candle shape forming at a known resistance level, prior high, or major moving average adds independent technical weight.
- Volume-confirmed variant: moderate volume on the doji followed by a clear pickup in volume on the third candle, suggesting the reversal reflects real participation rather than a thin, quiet session.
Some analysts also distinguish the pattern by how far the doji's shadows extend beyond the first candle's range: a doji with long shadows on both sides shows the market actively testing both directions before settling into equilibrium, which is a somewhat more emphatic version of the indecision signal than a doji with very short shadows.
Trading the Evening Doji Star
Entry: Conservative traders wait for the third candle to close well into the first candle's body — or for a fourth session to confirm — before entering short. More aggressive traders act as soon as the third candle closes below the doji's low.
Stop-loss: Above the doji's high is a reasonably tight placement; above the highest point of the whole three-candle formation is the more conservative choice.
Targets: Nearby support levels are the most realistic near-term goal. A projection measuring the distance from the first candle's low to the doji's high, applied downward from the third candle's close, offers a rough guide for a larger move.
Confirmation
The third candle largely confirms the doji's indecision by itself, but because the pattern is relatively uncommon, many traders still like to see continued weakness in the next session or two, ideally with a pickup in volume, before treating the reversal as reliable.
Combining with Technical Indicators
The pattern is more persuasive when RSI is deeply overbought with bearish divergence, when MACD momentum is clearly deteriorating into the pattern, or when the setup coincides with a major resistance level or moving average. Broader market or sector weakness around the same time adds further supporting context, though as always, indicator agreement improves the odds without guaranteeing the outcome.
Common Mistakes
- Accepting a small-bodied candle as the "doji" when the open and close aren't actually close to equal — that's really just an ordinary evening star, not the doji variant.
- Trading it without adequate uptrend context, or far from any resistance level.
- Ignoring shallow penetration on the third candle rather than requiring a close well into the first candle's body.
- Entering before the third candle closes, before the pattern is actually complete.
- Assuming rarity alone makes the pattern reliable — an uncommon setup still needs the same trend, resistance, and confirmation checks as any other.
Where It Fits in a Trading Plan
Because a true doji is uncommon, an evening doji star setup deserves the same discipline as any other trade rather than extra confidence simply for being rare. Mapping out support and resistance ahead of time, confirming that the broader trend and momentum indicators already look stretched, and sizing the position so a stop above the pattern's high is a small, planned loss all matter just as much here as with a plain evening star. Keeping notes on how this pattern has actually performed on a given stock or index — rather than assuming its reputation for strength guarantees results — is a reasonable way to build calibrated confidence over time.
FAQs
How is this different from a regular evening star?
Only the middle candle differs. A plain evening star just needs a small body for its star; the doji variant requires that candle to be a true doji, which many technicians treat as a somewhat stronger signal because it represents complete rather than partial indecision.
What's the bullish opposite of this pattern?
The morning doji star — the same structure appearing after a downtrend, signaling a possible bottom instead of a top.
Does the doji need to have zero range?
No — a doji can still have shadows extending above and below; what defines it is that the open and close are essentially equal, not that the candle has no range at all.
Why is this pattern considered rarer than a plain evening star?
A true doji, where open and close land at almost exactly the same price, is inherently less common than an ordinary small-bodied candle, so the stricter middle-candle requirement makes the overall pattern appear less frequently.
Is confirmation still useful given the doji's strength?
Yes. Even a textbook-perfect doji doesn't guarantee follow-through, so most traders still look for at least some continuation in the next session or two before fully committing.
Can the doji have long shadows and still count?
Yes. A doji is defined by the open and close being essentially equal, not by having no range at all — shadows extending above and below are common and, if anything, reinforce the sense that both buyers and sellers actively tested the session before ending in a standoff.
Conclusion
The bearish evening doji star sharpens the standard evening star by requiring genuine indecision — a true doji — at the moment the uptrend stalls. It occurs less often than the plain evening star, but the clean break in momentum it represents is generally viewed as a somewhat stronger reversal signal. As always, confirmation, resistance-level context, and supporting indicators improve the odds beyond what the pattern alone can offer.