Bearish Three Line Strike
Updated Aug 26, 2026
- Signal
- Bearish Continuation
- Reliability
- Moderate
- Rarity
- Rare
- Confirmation
- Recommended
- Trend Position
- Mid-Trend
- Best Timeframes
- Daily+
On this page
The Bearish Three Line Strike is a four-candle pattern that appears in a downtrend and looks, at first glance, like a dramatic reversal. Three consecutive bearish candles extend the decline, then a single long bullish candle opens below the third candle's low and closes above the first candle's high, engulfing all three prior sessions. Despite that bullish-looking finish, this is classified as a continuation pattern — the evidence is that downtrends interrupted this way typically resume rather than reverse, which is exactly why the pattern is worth learning even though it looks like the opposite of what it signals.
Recognizing the Pattern
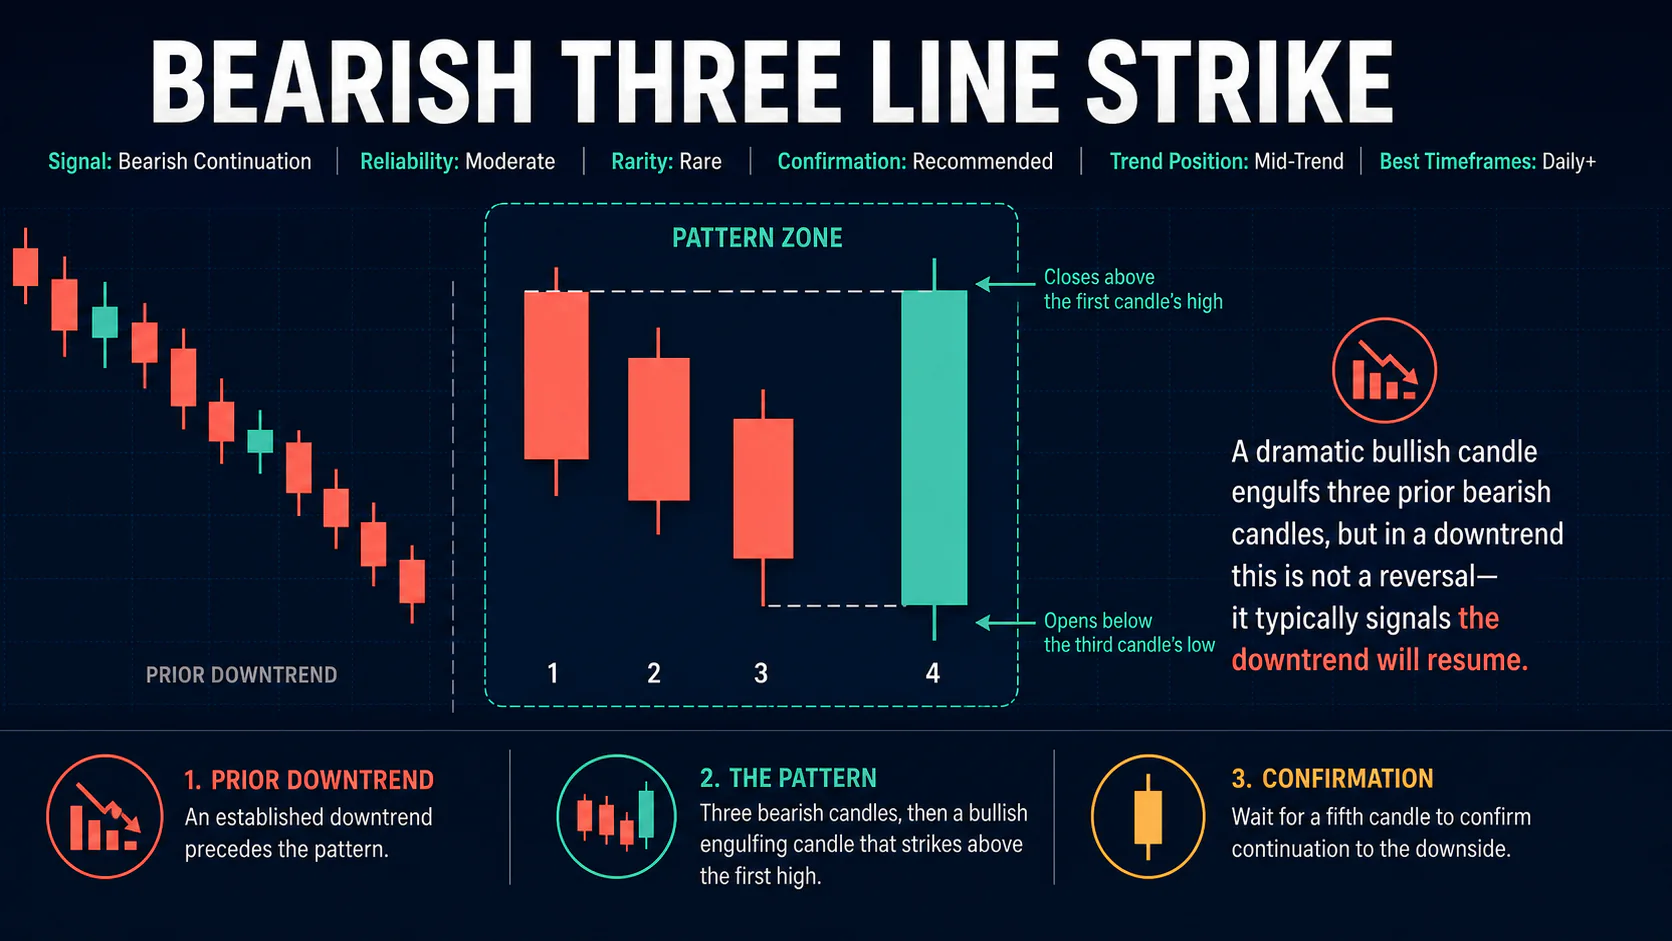
First three candles: consecutive bearish candles, each with a meaningful real body, establishing clear downward momentum. Progressively lower closes reinforce the pattern's validity.
Fourth candle: opens below the third candle's low, appearing to accelerate the decline, but reverses to close above the first candle's high, completely engulfing the three-candle sequence.
The pattern requires an established downtrend as context; it does not apply at support levels or after an extended decline where a genuine bottom is more plausible. It also works best on daily or higher timeframes, where a four-session formation carries more weight than it would intraday, since shorter timeframes generate this kind of shape far more often by pure noise. Where the four candles sit within the larger downtrend matters as much as their shape — a strike appearing early or in the middle of a well-established decline is a more textbook continuation setup than one appearing after the trend has already run for an extended period, where the odds of an eventual genuine reversal naturally increase.
Quick Recognition Checklist
- Established downtrend precedes the four-candle sequence
- Three consecutive bearish candles with meaningful real bodies
- Fourth candle opens below the third candle's low
- Fourth candle closes above the first candle's high, engulfing all three
- Pattern appears on daily or higher timeframes
- A fifth candle is needed to confirm continuation
A Bullish Mirror Image
The pattern also has a bullish version that forms in uptrends: three consecutive bullish candles followed by a single long bearish candle that engulfs all three, after which the uptrend typically resumes rather than reverses. Both versions share the same underlying idea — a dramatic, reversal-looking candle that traps traders betting on a genuine change in trend. Learning to recognize both directions helps avoid the same mistake regardless of which way the prevailing trend is pointing.
Market Psychology
The pattern unfolds in two contrasting phases: a period of sustained selling, followed by a dramatic but ultimately unsustainable reversal attempt.
First Three Candles: Sustained Selling
- Each session confirms that sellers remain in control
- Momentum traders and technical selling extend the decline
- Buyers show little willingness to step in ahead of the fourth candle
Fourth Candle: The Dramatic Reversal Attempt
- The gap-down open suggests one more push lower
- Short covering, bargain hunters, and technical buyers all pile in and drive the close above the first candle's high
- The size of the move can convince onlookers a genuine bottom has formed
What makes this pattern bearish rather than bullish is what happens next. Despite the size of that reversal candle, it tends to represent a single session of buying rather than a genuine change in control, and the prior sellers typically reassert themselves once the emotional buying has run its course.
Trading the Pattern
Entry
Because the fourth candle looks like a strong reversal, most traders wait for a fifth candle that opens below the fourth candle's low and closes in the lower half of its range before treating the pattern as confirmed continuation. Entering without that confirmation means betting against what looks, in the moment, like a genuine breakout.
Stop-Loss
A stop above the fourth candle's high is the standard placement — a sustained move above that level would suggest the reversal is real rather than a failed retracement. Tighter stops above the confirmation candle's high work for more aggressive entries, but only when that level lines up closely with the fourth candle's high.
Profit Targets
Targets are typically set by projecting the height of the original three-candle decline downward from the point of confirmation, or by aiming for the next significant support level. Given the pattern's rarity and moderate reliability, keeping targets grounded in visible support rather than aggressive extensions is the more disciplined approach.
Confirmation and Indicator Confluence
An RSI reading that stays below 50 through the pattern, or a MACD line that remains below its signal line despite the fourth candle's rally, both support the continuation read. A fourth candle that fails to close above a major moving average despite its size is another sign that the move was more emotional than structural.
Broader market context also helps: a Three Line Strike that forms while the overall market or sector remains in a clear downtrend is more likely to resolve as continuation than one appearing just as broader sentiment is turning.
Volume across the whole formation tells its own story. Steady or building volume through the first three candles supports genuine selling pressure, while a volume spike concentrated entirely on the fourth candle — without meaningful follow-through in the days after — often points to a short-lived squeeze rather than a change in the underlying trend.
Common Mistakes
- Trading the fourth candle as an immediate reversal signal — the pattern's entire premise is that this candle is a trap, not a genuine turn.
- Applying the pattern at support levels or after an extended downtrend, where the odds of a real reversal are much higher.
- Skipping the fifth-candle confirmation step in the interest of a better entry price.
- Using stops that don't account for the fourth candle's high as the key invalidation level.
- Treating every four-candle sequence that vaguely resembles this shape as a valid strike pattern without checking the engulfment and trend requirements carefully.
- Forgetting that the pattern is rare — forcing a trade on a near-miss version undermines the reliability the strict definition provides.
- Overlooking the broader market backdrop — a strike forming just as the overall market is bottoming is a weaker continuation candidate than one forming mid-decline.
FAQs
Isn't a candle that engulfs three prior candles a bullish signal?
It looks that way, which is exactly why this pattern catches reversal traders off guard. Historically, this specific setup — three bearish candles engulfed by one bullish candle within a downtrend — tends to resolve with the downtrend resuming rather than reversing.
Is there a bullish version of this pattern?
Yes — the bullish Three Line Strike is the mirror image: three up candles followed by one large down candle that engulfs them, after which the uptrend typically resumes.
How rare is this pattern?
It's an infrequent formation compared to simpler patterns like engulfing candles or haramis, since it requires a specific four-candle sequence.
What confirms that the pattern has failed?
A fifth candle that holds above the fourth candle's low, or subsequent sessions that continue higher, both suggest the reversal was genuine and the pattern has failed.
Does volume matter for this pattern?
Volume on the fourth candle is often elevated from both short covering and new buying, but declining volume on the fifth and later sessions, if the downtrend resumes, adds confidence to the continuation read.
Why would a trader want to know about a pattern this rare?
Even infrequent patterns are worth recognizing, since the alternative — mistaking the fourth candle for a genuine reversal and buying into it — is a specific, avoidable trap that this pattern is named for.
Should the fourth candle's size influence how much weight the pattern gets?
An exceptionally large fourth candle can actually reinforce the continuation read, since it suggests an emotional, unsustainable buying spike rather than measured, structural accumulation — the kind of buying that tends to fade once it runs out of new participants.
Conclusion
The Bearish Three Line Strike is a useful reminder that not every large reversal-looking candle marks an actual reversal. Traders who recognize the pattern's context — three bearish candles inside a downtrend, engulfed by a single bullish session — and who wait for confirmation before acting can use it to avoid being faked out of a still-intact downtrend, or to re-enter short positions after a brief, unsustainable bounce.