Bullish Three Line Strike
Updated Aug 26, 2026
- Signal
- Bullish Continuation
- Reliability
- High
- Rarity
- Uncommon
- Confirmation
- Recommended
- Trend Position
- Mid-Trend
- Best Timeframes
- Daily+
On this page
The Bullish Three Line Strike is a four-candle continuation pattern, not a reversal — despite its final candle looking like a sharp bearish reversal. It forms during an established uptrend: three consecutive long white candles each close higher than the last, then a fourth candle opens higher still but reverses hard, closing as one long black candle that engulfs all three prior white bodies. Counterintuitively, this dramatic-looking bearish candle typically marks a pause rather than a trend change — the uptrend usually resumes afterward.
How to Recognize the Pattern
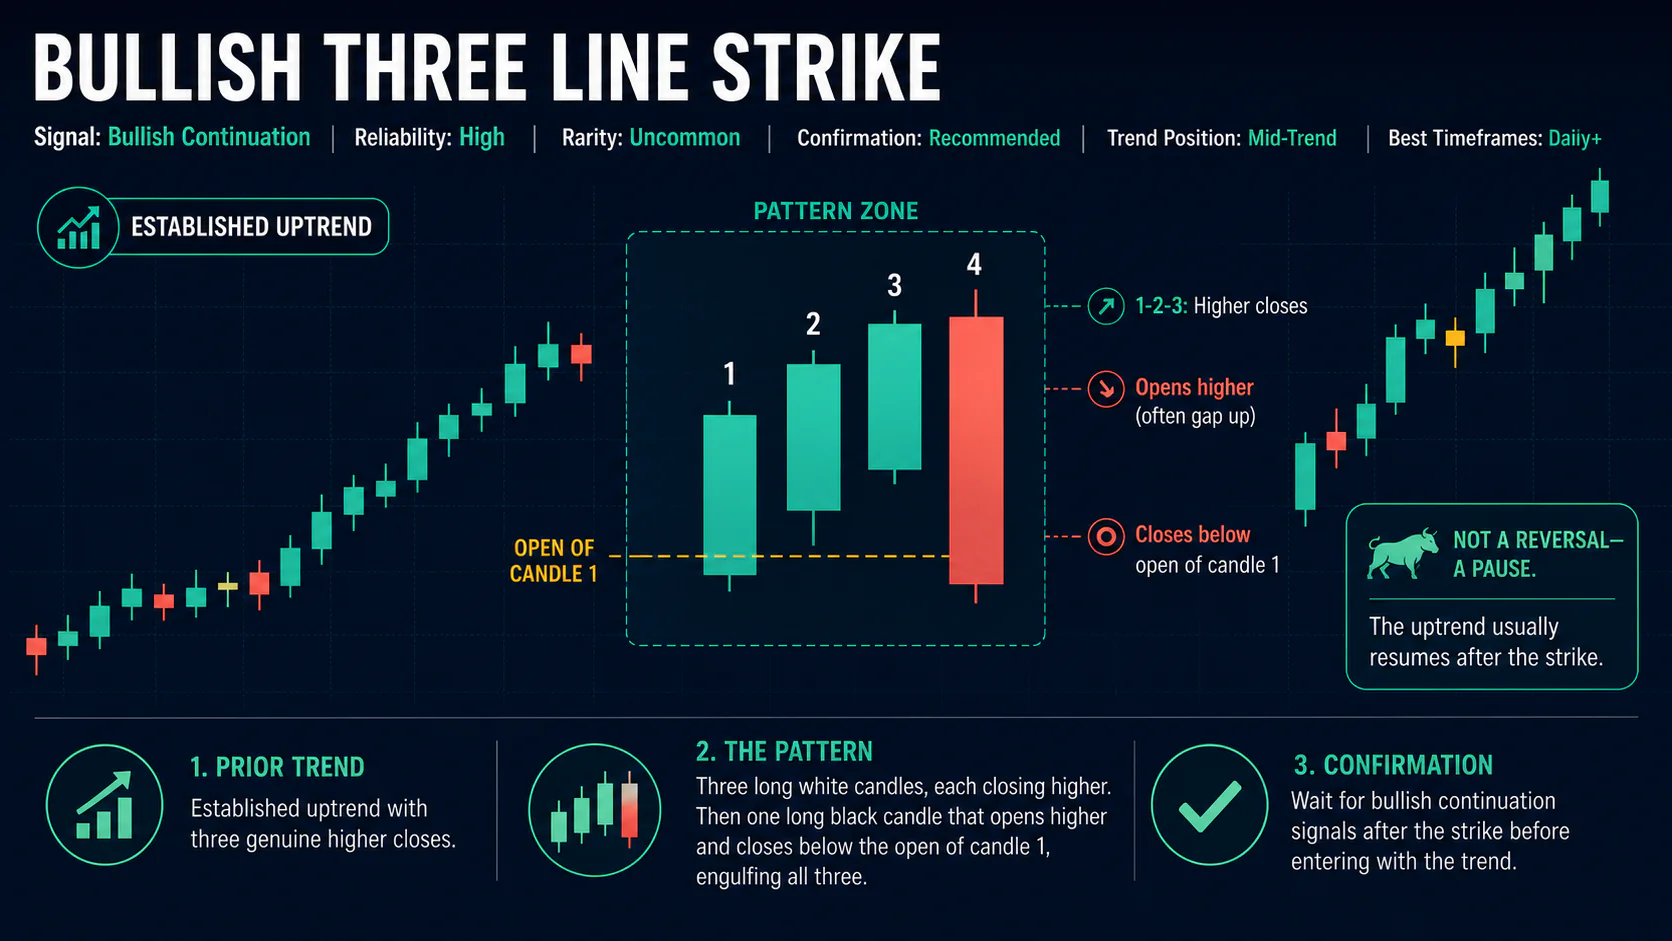
- First three candles: three consecutive long white candles in an uptrend, each opening within the prior candle's body and closing at a new high — structurally similar to Three White Soldiers.
- Fourth candle (the strike): a long black candle that opens above the third candle's close (often with a gap up) but reverses during the session and closes below the open of the first white candle, completely engulfing the three-candle advance.
The defining requirement is that final close: it must fall below the open of candle one, not just below its close. If the fourth candle doesn't retrace that far, you don't have a Three Line Strike — you likely have an ordinary pullback or a different bearish engulfing setup.
| Check | What to look for |
|---|---|
| Prior trend | Established uptrend with three genuine higher closes |
| First three candles | Long white candles, each closing above the last |
| Strike candle | Long black candle, closes below the open of candle one |
| Classification | Continuation — trade the resumption, not the strike candle itself |
Market Psychology
The first three candles show a healthy, orderly advance — buyers in control, each session building on the last. The fourth candle's opening gap-up suggests the advance is continuing, which is what makes the subsequent reversal so sharp: late buyers chasing the gap get caught, profit-taking from the three-day run accelerates, and the session closes deep in the red. On the surface this looks like an aggressive bearish engulfing signal. But because it follows a clean uptrend and the prior buying pressure was genuine rather than exhausted, the single sharp pullback more often resolves as a one-session flush of weak hands than the start of a real reversal — the broader uptrend typically continues in the sessions that follow. This is the main reason the pattern is classified as a continuation signal rather than a reversal, even though the strike candle itself looks bearish.
Variations
Gap-up strike: the classic version has the fourth candle opening with a gap above the third candle's close before reversing — the more pronounced the gap, the more dramatic (and often more convincing to onlookers) the apparent reversal looks, even though the pattern's own logic points the other way.
Accelerating three-candle run: when each of the first three candles is progressively larger than the last, the strike candle needed to fully engulf all three is necessarily larger too, which can make the reversal-looking session especially dramatic.
Mirror bearish version: a bearish Three Line Strike appears in a downtrend, built from three consecutive black candles followed by one long white candle that engulfs them — traditionally treated as a bearish continuation signal for the same reasons the bullish version favors continuation of an uptrend.
How It Differs From Similar Patterns
It's easy to mistake the fourth candle in isolation for a standard bearish engulfing pattern, but a normal bearish engulfing candle only needs to cover the single candle before it. The strike candle here has to engulf three full sessions of gains, which is both rarer and structurally different — and, unlike a bearish engulfing pattern (which does suggest a possible reversal), the Three Line Strike's own historical tendency runs toward continuation of the prior uptrend.
Trading the Pattern
Entry: Because the pattern is a continuation signal, most traders wait for price to resume making new highs after the strike candle — for example, a close back above the strike candle's high — rather than trading in the direction of the strike candle itself.
Stop-loss: A stop below the low of the strike candle is the standard invalidation level; a break below that low, especially with continued selling, suggests this may be turning into a genuine reversal rather than a one-session pullback.
Targets: Treat this like any other continuation setup — project the height of the preceding three-candle advance from the resumption point, and adjust toward the next real resistance level above the market.
Because the pattern requires trading against the visual impression of the most recent candle, it is easy to misapply. Traders unfamiliar with it often short the strike candle's apparent breakdown, which is the opposite of what the pattern's own track record supports.
Managing the Trade
Because the entry comes after price has already resumed making new highs, the trade is effectively a standard trend-continuation entry rather than something unique to this pattern. Raising the stop as new highs form, and treating the strike candle's low as a hard floor for as long as the position is open, keeps the risk framework simple.
Where It's Most Meaningful
The pattern depends on a clean, genuine three-candle advance, which is easiest to evaluate on daily and weekly charts where each candle reflects a full session's worth of participation. It also matters more in a stock that was already showing a durable uptrend over several weeks or months, rather than one making its first tentative attempt at a bounce — the "resume the trend" interpretation rests on the idea that the underlying demand was real to begin with.
Combining With Indicators
Because the strike candle can look alarming on its own, checking broader trend indicators helps avoid a knee-jerk bearish read. If price remains above a key moving average after the strike candle, or RSI stays out of oversold territory despite the sharp red candle, that supports treating the pattern as a pause rather than a reversal.
Common Mistakes
- Treating it as a reversal pattern. This is the single most common error — the strike candle looks bearish, but the pattern's classification is bullish continuation. Shorting the strike candle runs against the pattern's own logic.
- Accepting a strike candle that doesn't close below the first candle's open. If it only closes below the third or second candle's open, the engulfment is incomplete and the pattern isn't valid.
- Ignoring trend context. The pattern only makes sense in an established uptrend; three rising candles with no real prior trend don't carry the same implication.
- Requiring the strike candle to have low volume. Volume on the strike candle is often elevated precisely because of the reversal-like intraday action — that doesn't invalidate the pattern.
FAQs
Is the Three Line Strike bullish or bearish?
The bullish version described here is a continuation pattern that appears in an uptrend and, despite the sharp down candle, tends to resolve with the uptrend continuing. There's also a mirror-image bearish version that appears in downtrends with three black candles and one long white strike candle.
Why does a big bearish candle count as a bullish signal?
Because of what tends to happen afterward, not because of what the candle itself looks like. The pattern is defined by its tendency to be followed by a resumption of the prior uptrend rather than a fresh downtrend.
How is this different from a normal bearish engulfing candle?
A normal bearish engulfing candle only needs to engulf the one candle before it. The strike candle here engulfs three full sessions of gains, which is a much larger and more specific setup.
Should I buy right when the strike candle closes?
Most traders wait for signs the uptrend is resuming — such as a new high after the strike candle — rather than buying into the close of a candle that just posted a sharp loss.
Why is the pattern classified as uncommon rather than rare?
Three consecutive long white candles happen often enough in healthy uptrends, and a sharp one-session reversal after a run-up isn't unusual either — it's the combination of both, with the fourth candle's close falling all the way below the first candle's open, that narrows the field enough to make clean examples less frequent than everyday continuation setups, without being as scarce as the market's rarest reversal patterns.
Conclusion
The Bullish Three Line Strike is one of the more counterintuitive patterns in candlestick analysis: a sharp, engulfing bearish candle that traditionally signals the uptrend is likely to continue rather than reverse. The pattern depends entirely on that fourth candle closing below the first candle's open — anything less isn't a true strike. Because it runs against visual instinct, it rewards traders who wait for the uptrend to actually resume rather than reacting to the strike candle in isolation.