Bullish Matching Low
Updated Aug 26, 2026
- Signal
- Bullish Reversal
- Reliability
- Moderate
- Rarity
- Rare
- Confirmation
- Required
- Trend Position
- Downtrend Bottom
- Best Timeframes
- Daily+
On this page
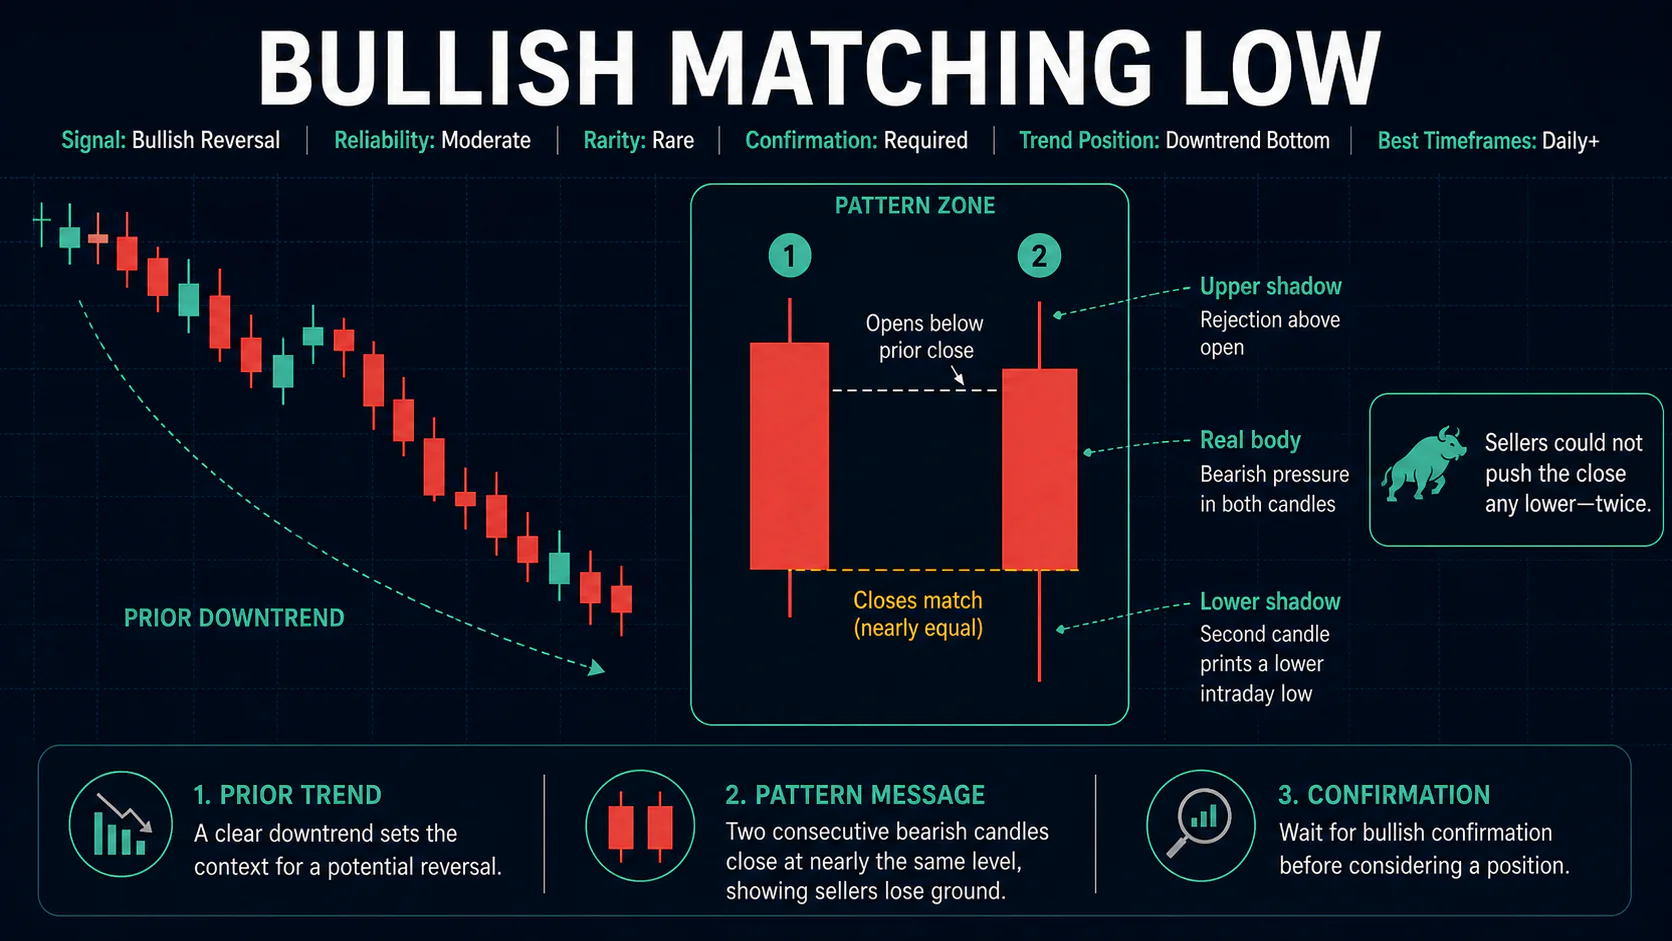
A bullish matching low is a two-candlestick reversal pattern in which two consecutive bearish candles, appearing after a downtrend, close at nearly the same price. The defining feature is the matching closing price, not the intraday low: the second candle can open lower and trade to a fresh low intraday, but if it closes back at roughly the same level as the first candle's close, sellers have failed to make further progress where it matters most, at the close. That inability to push closing prices any lower, twice in a row, is read as an early sign of selling exhaustion.
Recognition Criteria
First Candle
A meaningful bearish candle that establishes a closing price, ideally with real selling pressure behind it and above-average volume. This close becomes the reference level the rest of the pattern is built around, so the more decisive and well-formed this first candle is, the more meaningful the eventual match becomes.
Second Candle
Also bearish, and typically opens below the first candle's close, continuing the bearish tone. Despite that, it closes at nearly the same price as the first candle's close, conventionally within a small fraction of a percent. It may have a smaller real body than the first candle, and it can print a lower intraday low; what matters for the pattern is the matching close, not the matching low the name might suggest.
Critical Requirements
- Matching closes, not matching lows: the pattern's name refers to the market repeatedly finding the same closing level, not to the two candles' intraday lows being equal.
- Both candles bearish: the psychological point is that closing-price support holds despite continued bearish sentiment on both days.
- Downtrend context: the pattern needs a genuine prior decline to carry reversal significance.
- Volume: a decline in volume on the second candle is a modest positive sign of fading selling pressure, though not a strict requirement.
Market Psychology
Establishing the Level
The first candle closes at a level that becomes a reference point for the market. Sellers are clearly in control that day, and the closing price reflects genuine bearish conviction rather than an arbitrary number that just happens to appear on the chart.
The Failed Retest
On the second day, sellers try again, often opening the session lower, but by the close, price has been pulled back to almost exactly the same closing level as the day before. Bears had a full session to drive the close meaningfully lower and could not, despite starting the session from a position of apparent strength.
What the Repetition Signals
That repeated failure to close at a new low, even while the candles themselves remain bearish in color, suggests buyers are stepping in specifically to defend that closing level. Two sessions closing at the same level under continued selling pressure is a more deliberate signal than a single session holding a level once, since it shows the defense is not a one-off accident.
Variations
Classic matching low: two bearish candles with closes matching closely, in a clear downtrend.
Gap-down matching low: the second candle opens with a more pronounced gap down but still closes back at the first candle's level, arguably a stronger demonstration of closing-price support since sellers had an even bigger head start.
Support-confluence matching low: the matching close level coincides with a prior swing low, moving average, or round number, adding technical significance.
Extended matching low: a third or fourth session also closes near the same level before the eventual reversal, which strengthens the case for genuine closing-price support the more times it repeats.
How the Name Causes Confusion
The pattern's name is one of the more misleading in candlestick terminology, and it is worth spending a moment on why. Most support-based patterns, like a double bottom, are defined by matching intraday lows: the price touches the same floor twice and bounces. The matching low candlestick pattern instead asks whether the market keeps ending the session at the same price under continued selling, which is a subtly different and, in some ways, more demanding test, since a close is where positions are actually marked and where many stop and limit orders are triggered. Traders coming from other markets or other pattern families sometimes carry over the double-bottom intuition and start looking for two identical intraday lows, which is exactly the wrong thing to search for here.
Market Context
The pattern means more when the matching close level has some independent significance, such as a prior swing low, a round number, or a level that lines up with a major moving average, than when it is simply wherever two bearish sessions happened to land. It also carries more weight the more mature the preceding downtrend is; a matching low that appears early in a fresh decline is a much weaker signal than one appearing after an extended slide that already shows other signs of exhaustion, such as narrowing daily ranges or declining volume on down days.
Trading the Bullish Matching Low
Entry
Wait for a subsequent session to close above the high of the two-candle pattern, confirming that the closing-price defense has turned into upward momentum. A gap up above the pattern high on strong volume is the clearest form of confirmation, since it shows buyers unwilling to even test the recently defended level again before pushing higher.
Stop Loss
Place stops below the matching close level, or the lower of the two candles' intraday lows for a more conservative placement. A break of that level negates the closing-price defense the pattern represents, since it means sellers finally succeeded at doing what they failed to do during the pattern itself.
Profit Targets
Target the next meaningful resistance level above the pattern. Some traders measure the height of the larger of the two candles and project it upward from the confirmation breakout as a rough guide, adjusting toward actual resistance levels rather than following the projection mechanically.
Confirmation and Combining with Indicators
Look for supporting evidence such as RSI in oversold territory with bullish divergence, or the matching-close level coinciding with a well-established support zone or major moving average. A related pattern built on the same closing-price-defense idea, but across three candles, is the stick sandwich, which extends the same logic with an additional bullish session in between the two matching closes.
Common Mistakes
Recognition Errors
- Looking for matching intraday lows instead of matching closes; this is the single most common misreading of the pattern.
- Accepting closes that differ too much to represent genuine closing-price support.
Trading and Risk Mistakes
- Trading the pattern outside of a real downtrend, where matching closes carry no reversal significance.
- Skipping confirmation and assuming the matching close alone guarantees a reversal.
- Ignoring how much independent significance the matching close level actually has before weighting the setup too heavily.
FAQs
Does "matching low" mean the two candles have the same intraday low?
No. Despite the name, the pattern is defined by the two candles closing at nearly the same price, not by their intraday lows matching. The second candle can trade to a fresh intraday low and still qualify, as long as it closes back near the first candle's close.
Why do both candles need to be bearish?
Because the signal is that sellers, despite maintaining a bearish close on both days, cannot push that closing price any lower; the exhaustion shows up specifically within a bearish framework rather than through an obvious change in candle color.
How is this different from a double bottom?
A double bottom is a broader chart pattern that can form over many sessions and is usually defined by matching intraday lows; the matching low candlestick pattern is a tight, two-session pattern defined by matching closes.
Is this a common pattern?
No, it is considered a relatively rare candlestick pattern, so genuine, well-formed examples do not appear often.
What if the closes are close but not exact?
Real markets rarely produce exact matches; closes within a small fraction of a percent of each other are generally accepted as satisfying the pattern.
Can the second candle have a larger body than the first?
It can, though it is somewhat less typical; what matters most for the pattern's validity is the matching close, not the relative size of the two real bodies.
Does the pattern still count if more than two sessions separate the two matching closes?
No, the classic definition requires the two bearish candles to be consecutive; a similar close appearing several sessions later is better treated as general support-level evidence rather than as the specific matching low pattern.
Conclusion
The bullish matching low is a compact, two-session pattern whose signal comes from repeated closing-price support rather than matching intraday lows, a distinction worth remembering, since the name is easy to misread.
When two bearish candles in a downtrend close at nearly the same level, it suggests sellers have stopped making progress at the close, and a confirmed break above the pattern's high adds weight to a potential reversal. As with most two-candle patterns, it works best as one input alongside the broader trend, volume, and nearby support, rather than as a standalone trading signal.