Bullish Separating Lines
Updated Aug 26, 2026
- Signal
- Bullish Continuation
- Reliability
- Moderate
- Rarity
- Common
- Confirmation
- Recommended
- Trend Position
- Uptrend
- Best Timeframes
- Daily+
On this page
Bullish Separating Lines is a two-candle continuation pattern that appears during an uptrend. A bearish candle briefly interrupts the rally, but the next candle opens at essentially the same price as the prior candle's open and then rallies to a higher close, erasing the pullback and confirming that buyers remain in control. Because it depends on two candles opening at nearly the same price, clean examples take some looking for, though the pattern is common enough to be a useful everyday continuation signal.
Recognition Criteria
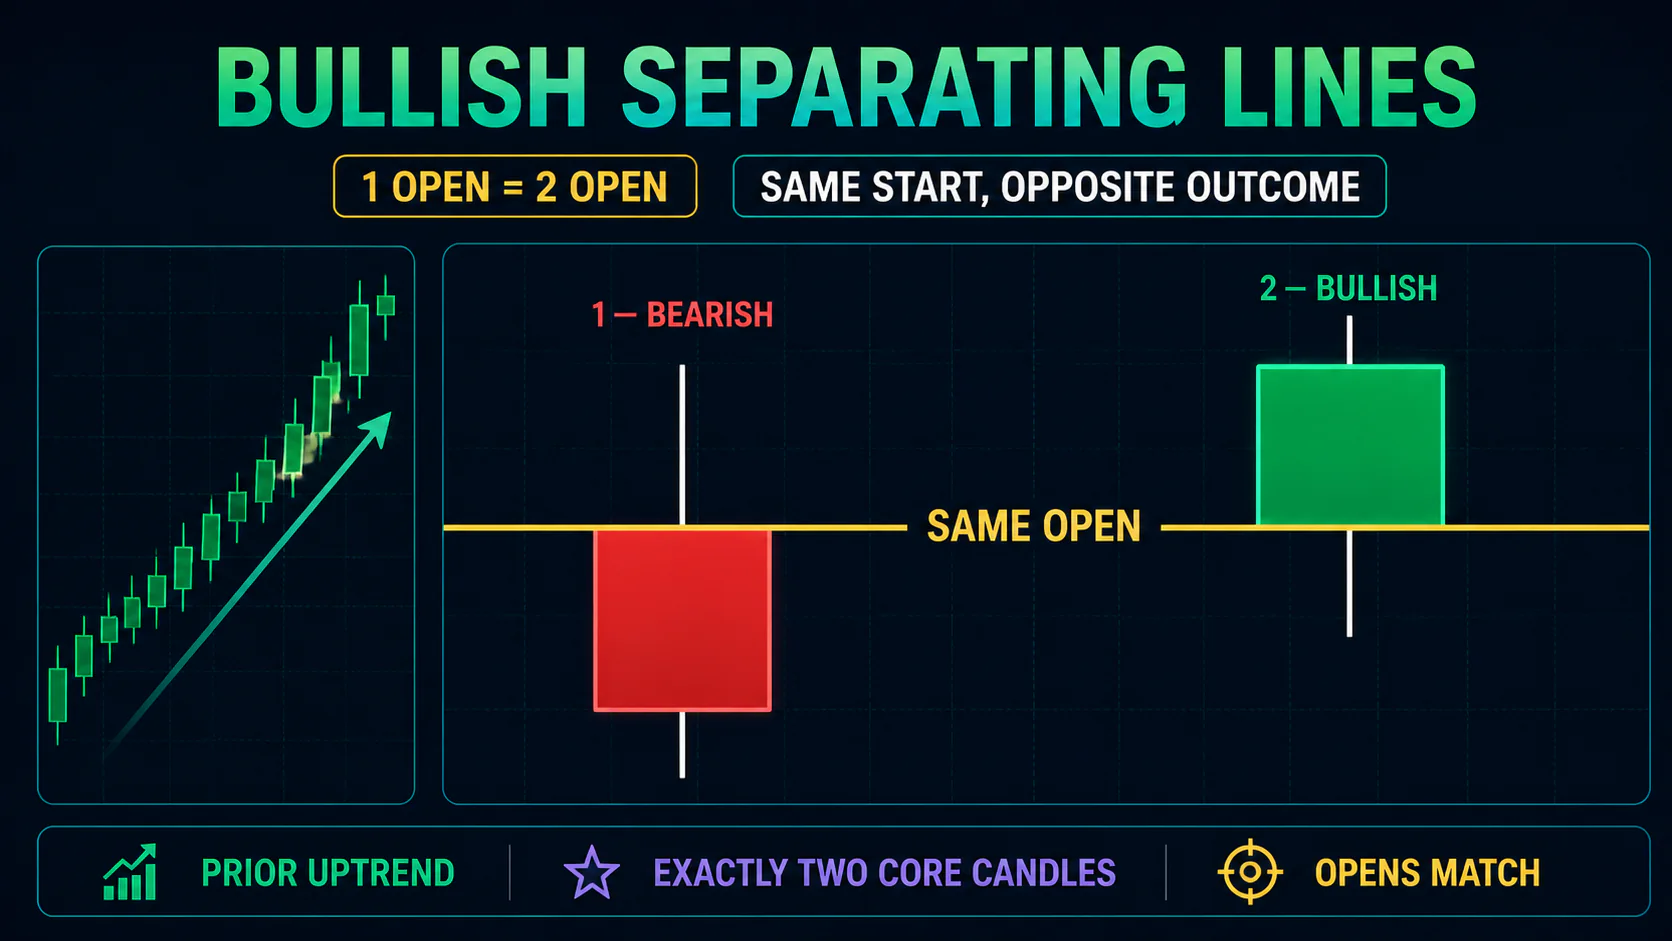
First candle: a bearish candle that closes lower, appearing to interrupt or threaten the prevailing uptrend.
Second candle: a bullish candle that opens at essentially the same price as the first candle's open — not its close — effectively gapping back up to erase the first candle's decline, then closing meaningfully higher.
Context: the pattern only carries continuation meaning inside an established uptrend. The same shape appearing in a downtrend (a white candle followed by a black candle sharing an open) is the bearish separating lines pattern, which continues the downtrend rather than reversing it.
Both candles should have real bodies of meaningful size — thin, doji-like candles undercut the separation effect that gives the pattern its name and its psychological weight.
Market Psychology
The first candle looks like the start of a correction: sellers push the session lower and the uptrend appears to be pausing. The second candle opens at that same level — effectively wiping out the prior decline in a single move — and buyers then extend the advance to a strong close. The matching open with an opposite outcome is what "separates" the two candles: identical starting points, completely different results. That contrast shows the pullback failed to attract meaningful follow-through selling, and that demand at the prior level remains intact.
Trading the Pattern
Entry
Most traders enter at or shortly after the close of the second, bullish candle, once the pattern is fully formed. More conservative traders wait for the next session to hold above the second candle's close before adding exposure.
Stop Loss
A logical stop sits below the low of the two-candle pattern — a move back below that level negates the continuation thesis. A nearby swing low or moving average can offer a tighter, better-placed alternative.
Targets
Because this is a continuation pattern, target the next resistance level in the direction of the existing uptrend rather than an arbitrary percentage move. Projecting the size of the second candle's body upward from the pattern high gives a simple minimum objective; nearby swing highs are typically a better guide.
Confirmation and Indicators
Volume that picks up on the second, bullish candle relative to the first adds confidence that the rebound reflects real buying rather than a low-volume drift. A next-day close above the second candle's high is the simplest confirmation. Momentum tools add context: an RSI reading that holds above 50 through the pattern, or a MACD line staying above its signal line, both support the idea that the uptrend's underlying momentum is intact rather than exhausted.
Common Mistakes
Ignoring trend context: the pattern only has continuation meaning inside an established uptrend. The same shape after a downtrend is not a valid bullish separating lines setup.
Accepting a loose opening match: if the second candle's open differs meaningfully from the first candle's open, the defining feature of the pattern is missing.
Trading small-bodied versions: thin, indecisive candles reduce the pattern's reliability even when the opens technically line up.
Treating it as a reversal signal: separating lines confirm an existing trend rather than calling a new one — using it to pick bottoms in a downtrend misapplies the pattern.
FAQs
Is the Bullish Separating Lines a reversal or a continuation pattern?
It's a continuation pattern. It appears during an uptrend and signals that a brief bearish candle has failed to change the trend's direction.
What makes it different from an engulfing pattern?
An engulfing pattern is defined by one candle's body swallowing the prior candle's body. Separating lines are defined by a shared opening price between the two candles, with the bodies then moving in opposite directions from that shared point.
Does the opening price have to match exactly?
In practice, a small difference of a few ticks in a liquid stock is generally acceptable. A meaningfully different open weakens the pattern's psychological logic.
How does this compare to Bullish Meeting Lines?
Bullish Meeting Lines is a related two-candle pattern that matches the candles' closing prices rather than their opens, and it appears at the bottom of a downtrend as a reversal signal rather than a continuation signal.
Should I trade this pattern without confirmation?
Because it's a fairly common pattern of only moderate reliability, waiting for a volume pickup or a follow-through close above the second candle's high is a reasonable filter before committing full size.
Conclusion
Bullish Separating Lines is a straightforward way to read a one-day pullback inside an uptrend: watch whether the next candle reopens at the same level and pushes back to a higher close. When it does, the pullback has failed to gain traction and the prevailing trend has reasserted itself. Treat it as one input alongside volume and momentum confirmation rather than a standalone signal, and remember it confirms trends already in progress rather than calling new ones.