Bullish Belt Hold
Updated Aug 26, 2026
- Signal
- Bullish Reversal
- Reliability
- Moderate
- Rarity
- Common
- Confirmation
- Recommended
- Trend Position
- Downtrend Bottom/Mid-Trend
- Best Timeframes
- Daily+
On this page
A bullish belt hold is a single-candlestick pattern with a long real body that opens at or very near the session’s low and closes at or very near the session’s high, with little to no lower shadow. It shows buyers in control from the opening bell through the close. Depending on where it appears, it can act as a reversal signal after a downtrend or as a continuation signal during an uptrend.
Recognition Criteria
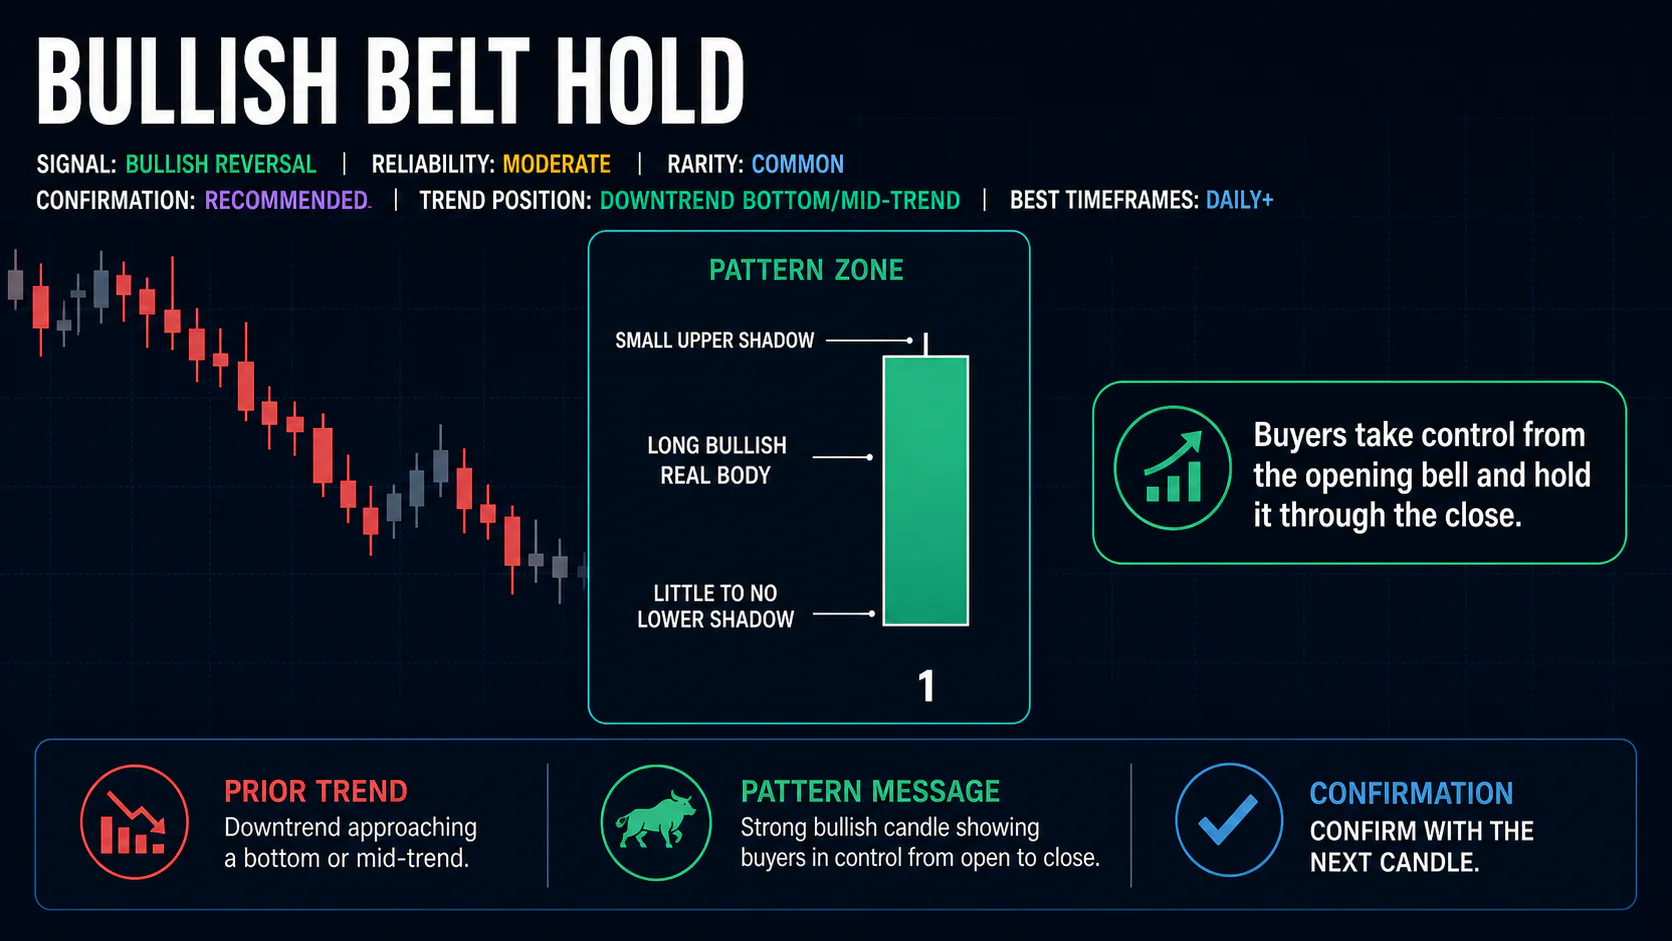
- The session opens at or very close to its low, with little or no lower shadow
- A long bullish real body makes up most of the session’s total range
- The upper shadow, if any, is small — a large upper shadow would suggest sellers pushed back meaningfully near the close
- The pattern is most meaningful after a downtrend (as a potential reversal) or during an uptrend (as a continuation signal); in a sideways market it carries less significance
Because there’s no confirming close-near-the-open the way there is with a hammer, the strength of a belt hold comes almost entirely from how much of the range the body occupies and how little shadow surrounds it.
Market Psychology
The opening at the session’s low, followed immediately by sustained buying, shows that sellers had essentially no opportunity to establish control — buyers were in charge from the first trade. That pressure continues through the session, and a close at or near the high confirms buyers held the advantage all the way to the end, without meaningful profit-taking or renewed selling. When this occurs after a decline, it suggests a sudden and decisive shift in sentiment; when it occurs during an uptrend, it suggests the existing move still has conviction behind it.
Variations
A belt hold with an unusually large body relative to its total range, and almost no upper shadow, is generally viewed as a stronger example than one with a more modest body or a visible upper shadow. A belt hold that also gaps up from the previous session’s close combines gap strength with the pattern’s own momentum, which some traders view as an even more convincing signal. Volume that runs noticeably above average during the session is a reasonable supporting factor, though not a formal requirement.
Trading the Belt Hold
Entry
Some traders enter directly on the belt hold itself, particularly when it forms at a well-established support level with decent volume. More conservative traders wait for the next session to continue higher, or for price to clear the belt hold’s high, before committing.
Stop-Loss
Stops are commonly placed below the belt hold’s opening price — its low — since a break back below that level undermines the idea that buyers took full control of the session.
Targets
The next meaningful resistance level above the pattern is the most realistic first target. Some traders project the length of the belt hold’s body upward from the high as a rough estimate, adjusting as price approaches known resistance.
Combining With Indicators
A belt hold that closes above a key moving average, or that coincides with the RSI breaking back above 50 from oversold territory, carries more weight than one appearing without such context. A MACD histogram turning positive around the same session adds further, independent support. As with any single-candle pattern, these indicators help judge the surrounding conditions rather than substituting for the pattern’s own requirements.
Common Mistakes
- Accepting patterns with a meaningful lower shadow, which contradicts the “opens at the low” requirement that defines the pattern
- Ignoring trend context — the same shape means something different as a reversal signal versus a continuation signal
- Entering without considering nearby resistance, which can cap the move shortly after entry
- Overlooking volume, which can help separate a conviction-driven session from a thinly traded one
FAQs
Can a bullish belt hold be a continuation signal instead of a reversal?
Yes. The same pattern that signals a possible reversal after a downtrend can also appear during an established uptrend, where it suggests buyers are reasserting control rather than reversing a decline.
How is a belt hold different from a bullish hammer?
A hammer has a small body and a long lower shadow, showing price was pushed down and then recovered within the session. A belt hold has a long body with essentially no lower shadow at all, showing buyers were in control from the opening trade rather than having to fight back from a decline.
Does a belt hold need a lower shadow at all?
No — ideally it has none. Any meaningful lower shadow means the session didn’t truly open at its low, which weakens the pattern.
Is confirmation necessary for a belt hold?
It’s not strictly required, since the pattern itself already shows a full session of buyer control, but a following session that continues higher adds meaningful reassurance, particularly for belt holds with a more modest body or a visible upper shadow.
Conclusion
The bullish belt hold is a straightforward single-candle pattern: a long body opening at the session’s low and closing near its high, with buyers in control from start to finish. Its simplicity is part of its appeal, but like other single-candle signals it benefits from context — a real support level, a supportive volume reading, and awareness of nearby resistance — before being treated as an actionable trade setup.