Bullish Inverted Hammer
Updated Aug 26, 2026
- Signal
- Bullish Reversal
- Reliability
- Moderate
- Rarity
- Common
- Confirmation
- Required
- Trend Position
- Downtrend Bottom
- Best Timeframes
- Daily+
On this page
A bullish inverted hammer is a single-candlestick reversal pattern that forms after a downtrend. It has a small real body near the low of the session’s range, little or no lower shadow, and an upper shadow at least twice the length of the body. It is the mirror image of the standard hammer, and because the session closes back down near its low rather than near its high, it needs the following session’s follow-through to be treated as a genuine reversal signal.
Recognition Criteria
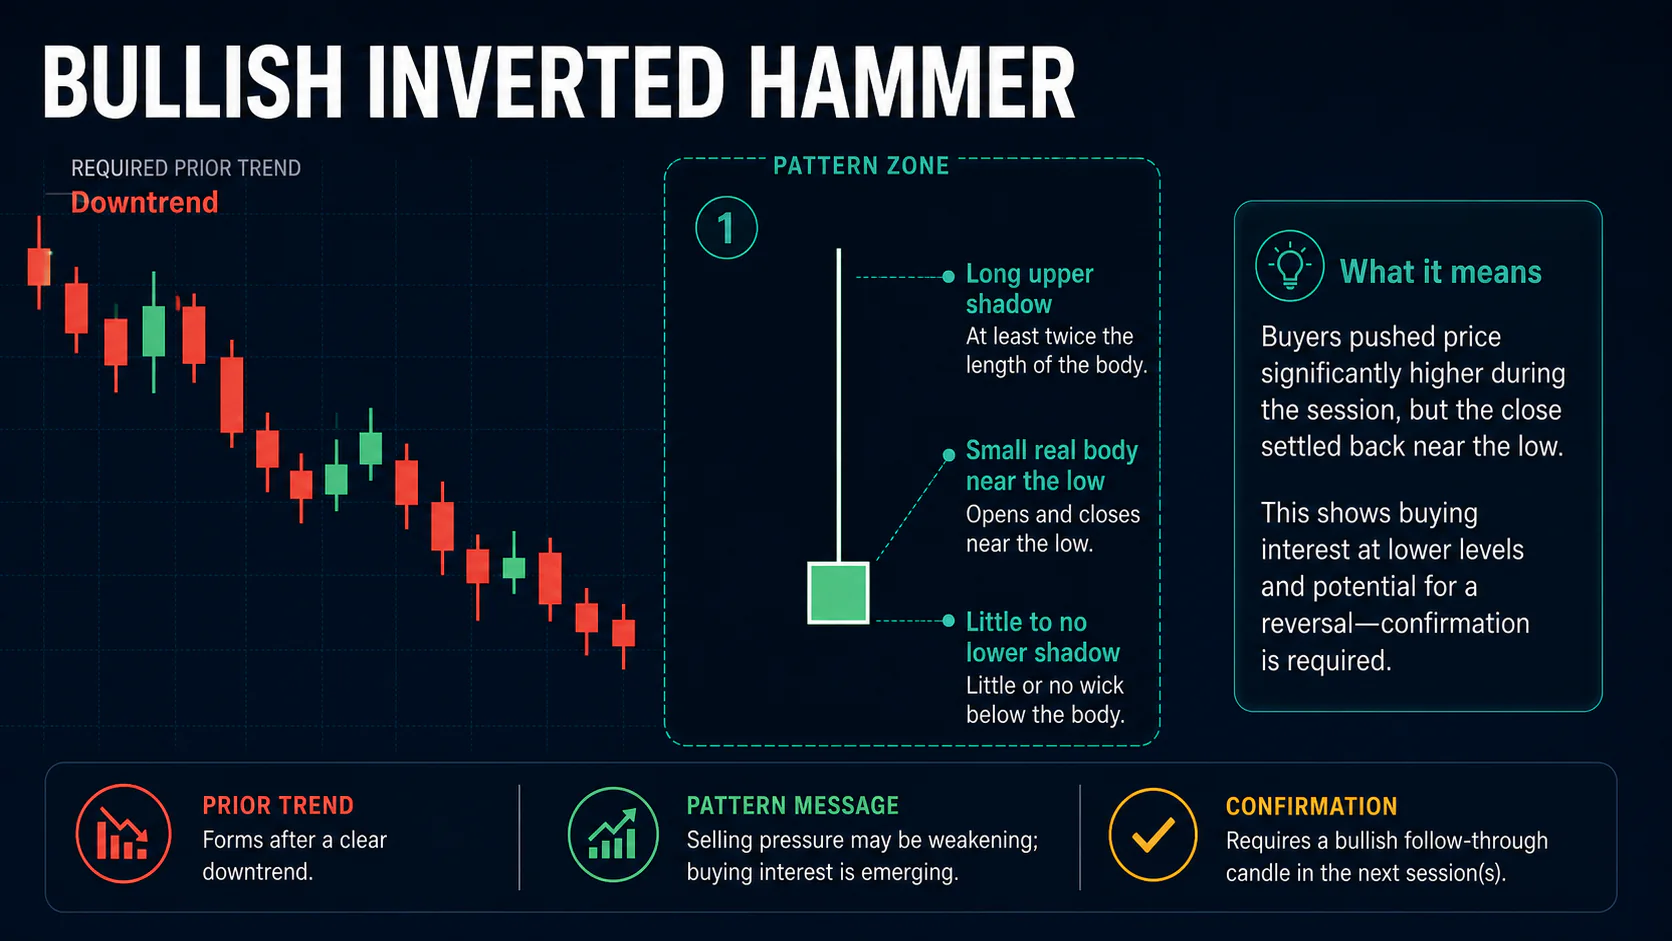
- A small real body, positioned at or near the low of the session’s range
- An upper shadow at least twice the length of the real body
- Little to no lower shadow
- Formation after a clear downtrend
As with the standard hammer, body color is secondary — what matters is the shape. The long upper shadow shows that buyers pushed price meaningfully higher at some point during the session, even though the close settled back near the open.
Market Psychology
The session opens near its low, and an early attempt by sellers to extend the decline fails to gain traction. Buyers then push price substantially higher intraday, demonstrating that demand exists at these levels, but profit-taking or renewed selling pulls price back down to close near the open. The net effect is a session that shows real buying interest without an accompanying vote of confidence from the close itself — which is precisely why this pattern is treated as requiring confirmation rather than as a standalone reversal signal.
Variations
An inverted hammer where the open and close are nearly identical is sometimes described as a doji-like inverted hammer, combining the indecision of a doji with the long upper shadow of the pattern. As with any hammer variant, formation at a well-established support level, a round number, or a major moving average adds more weight to the signal than a similar candle appearing in open space.
Trading the Inverted Hammer
Entry
Confirmation is not optional here the way it can be with a standard hammer. Enter only after the next session closes above the inverted hammer’s high, ideally with a gap up or noticeably higher volume that shows buyers picked up where the prior session’s intraday rally left off.
Stop-Loss
Stops belong just below the inverted hammer’s low. Because the pattern only becomes actionable once confirmation appears, there is little reason to loosen this level — a move back below it means the setup has failed.
Targets
Nearby resistance is the most realistic first target. As with the standard hammer, some traders project the length of the upper shadow above the confirmation high as a rough minimum objective, though this is a guideline rather than a rule.
Confirmation
Confirmation means a subsequent close above the inverted hammer’s high, and the strongest version of that confirmation is a gap up that holds on above-average volume. Multiple sessions of continued advance are a better validation than a single strong close, since they show the buying interest from the pattern wasn’t a one-session event.
Combining With Indicators
An inverted hammer forming while the RSI is below 30, or while stochastic readings are oversold, adds context suggesting the prior decline was overextended. A bullish MACD divergence developing around the same time can add further, independent support. These readings don’t substitute for confirmation — they simply help judge whether the broader technical backdrop is consistent with a reversal.
Common Mistakes
- Trading the pattern on the inverted hammer session itself, without waiting for the confirming close
- Accepting a body that is too large relative to the upper shadow, which weakens the pattern’s significance
- Ignoring trend context — a similar shape can appear in other settings without carrying the same implication
- Treating any modest uptick the next day as sufficient confirmation, rather than requiring a clear close above the pattern’s high
FAQs
Why does the inverted hammer need confirmation more than a regular hammer?
A regular hammer closes near its high, showing buyers were in control by the end of the session. An inverted hammer closes back near its low despite the intraday rally, so the close itself doesn’t confirm that buyers held the advantage — the next session has to do that.
Is the inverted hammer the same as a shooting star?
The two look alike — small body, long upper shadow, little lower shadow — but trend context makes them opposite signals. An inverted hammer appears after a downtrend and is potentially bullish; a shooting star appears after an uptrend and is potentially bearish.
How does this differ from a bullish hammer?
The hammer’s long shadow is on the bottom and it closes near its high; the inverted hammer’s long shadow is on top and it closes near its low. The hammer’s close offers more built-in confirmation, which is part of why the inverted hammer’s confirmation requirement is treated as stricter.
What timeframes work best for this pattern?
Daily charts and higher are preferred, since gaps and shadow proportions carry more weight when institutional participation is heavier. On very short intraday timeframes, similarly shaped candles form far more often from noise alone.
Conclusion
The bullish inverted hammer shows that buyers were willing to step in and push price higher after a decline, even though the close doesn’t confirm it on its own. Because the pattern leaves that confirmation gap open, it should be treated as a setup to watch rather than a signal to act on immediately — wait for the next session to close above the pattern’s high, ideally with supportive volume, before treating it as an actionable reversal.