Bullish Morning Star
Updated Aug 26, 2026
- Signal
- Bullish Reversal
- Reliability
- High
- Rarity
- Rare
- Confirmation
- Recommended
- Trend Position
- Downtrend Bottom
- Best Timeframes
- Daily+
On this page
A bullish morning star is a three-candlestick reversal pattern that appears after a downtrend. It consists of a long bearish candle, a small-bodied candle that gaps down from it, and a long bullish candle that closes well into the first candle’s body. The name comes from its resemblance to the morning star that appears just before dawn — a signal that a downtrend may be ending.
Recognition Criteria
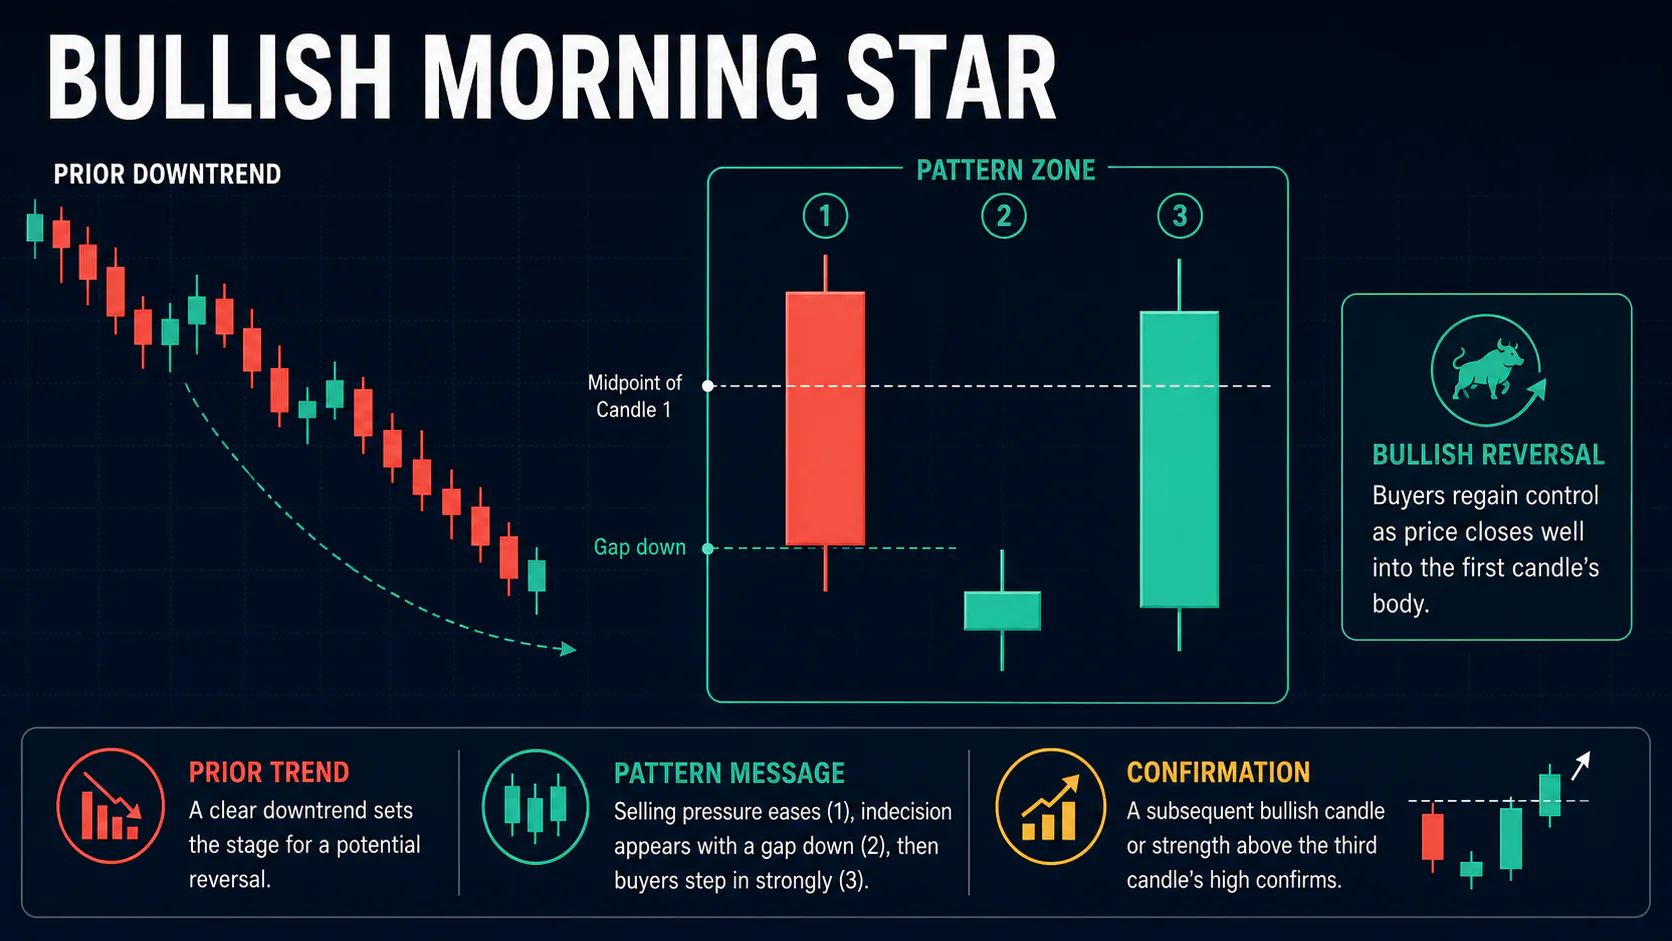
First candle: A large bearish candle continuing the existing downtrend, with a substantial real body showing decisive selling pressure.
Second candle: A small-bodied candle — the “star” — that gaps down from the first candle’s close. It can be bullish or bearish; what matters is that its real body is much smaller than the first candle’s, reflecting indecision between buyers and sellers.
Third candle: A large bullish candle that closes well into the first candle’s real body, ideally beyond its midpoint, showing buyers have regained control.
- The pattern must appear after a clear, multi-session downtrend
- The star candle should gap down from the first candle’s close
- The third candle should close more than halfway into the first candle’s body — deeper penetration is a stronger signal
- Volume that builds into the third candle is a useful supporting signal, though not a strict requirement
Market Psychology
The pattern tells a three-session story. The first candle shows sellers firmly in control, often the tail end of panic selling or a technical breakdown. The star candle shows that control breaking down — neither buyers nor sellers can push price meaningfully, often because the decline has reached a level where value buyers start to show interest. The third candle resolves that indecision decisively in favor of the bulls, with enough buying to erase a significant portion of the first candle’s decline.
Variations
When the star candle is a true doji (open and close nearly identical), the pattern becomes a bullish morning doji star, generally considered a somewhat stronger version because the indecision is more pronounced. A third candle that closes near the top of the first candle’s body, essentially erasing the entire prior session’s decline, represents an especially strong example, though this doesn’t change the pattern’s core requirements.
Trading the Morning Star
Entry
A conservative approach waits for a close above the third candle’s high before entering, trading some profit potential for confirmation. A more active approach enters on a break above the high of the entire three-candle pattern.
Stop-Loss
Stops are commonly placed below the low of the star candle, since a break below that level undermines the reversal thesis. A wider stop below the entire pattern’s low offers more room for normal volatility at the cost of additional risk per trade.
Targets
Prior resistance levels broken during the preceding downtrend make reasonable first targets. Some traders project the height of the first candle upward from the entry point as a rough measured-move estimate, then look to swing highs or major moving averages for further targets.
Combining With Indicators
A morning star forming near a major support level, a key retracement level, or a significant moving average carries more weight than one appearing in open space. RSI bullish divergence, a MACD crossover, or stochastic readings moving out of oversold territory around the time of the third candle all add supporting context, though none of them are part of the pattern’s definition.
Common Mistakes
- Mistaking a two-candle formation for a morning star, or missing the gap between the first candle and the star
- Accepting a middle candle whose body isn’t meaningfully smaller than the first candle’s
- Entering before the third candle closes, before the pattern is actually complete
- Ignoring the broader trend and support context — the pattern is far less meaningful without a genuine prior downtrend
FAQs
Does the star candle have to be a doji?
No. A standard morning star only requires a small real body on the middle candle. When that candle is a true doji, the pattern is more specifically a morning doji star, generally viewed as a somewhat stronger variant.
How far does the third candle need to close into the first candle’s body?
More than halfway is the commonly used threshold for a solid morning star. Closes deeper into the first candle’s body, closer to its open, are viewed as stronger versions of the pattern.
How is this different from a bullish piercing line?
The piercing line tells a similar story in two candles instead of three, without the small-bodied star candle in between. The morning star is rarer and generally considered somewhat more reliable because of the added indecision phase.
Does the pattern work on intraday charts?
It can appear on any timeframe, but it’s more meaningful on daily charts and higher, where the gaps between candles carry real significance rather than reflecting routine market noise.
Conclusion
The bullish morning star is one of the more respected three-candle reversal patterns, tracing a clear path from bearish control through indecision to renewed buying. It occurs less often than two-candle patterns like the piercing line or engulfing pattern, but its added structure — and the requirement that the third candle close well into the first candle’s body — makes it a useful signal to watch for at the end of an extended decline, alongside confirmation and a sensible support level.