Bullish Three Stars in the South
Updated Aug 26, 2026
- Signal
- Bullish Reversal
- Reliability
- High
- Rarity
- Extremely Rare
- Confirmation
- Required
- Trend Position
- Downtrend Bottom
- Best Timeframes
- Daily+
On this page
Three Stars in the South is a rare three-candle bottoming pattern made up of three consecutive bearish (black) candles that shrink in size and stabilize in price, signaling that selling pressure is running out even though every candle in the pattern is still technically bearish. It appears at the end of a downtrend and is one of the least frequently seen candlestick patterns in classical Japanese charting — which is part of why, when it does appear cleanly, it's taken seriously.
How to Recognize the Pattern
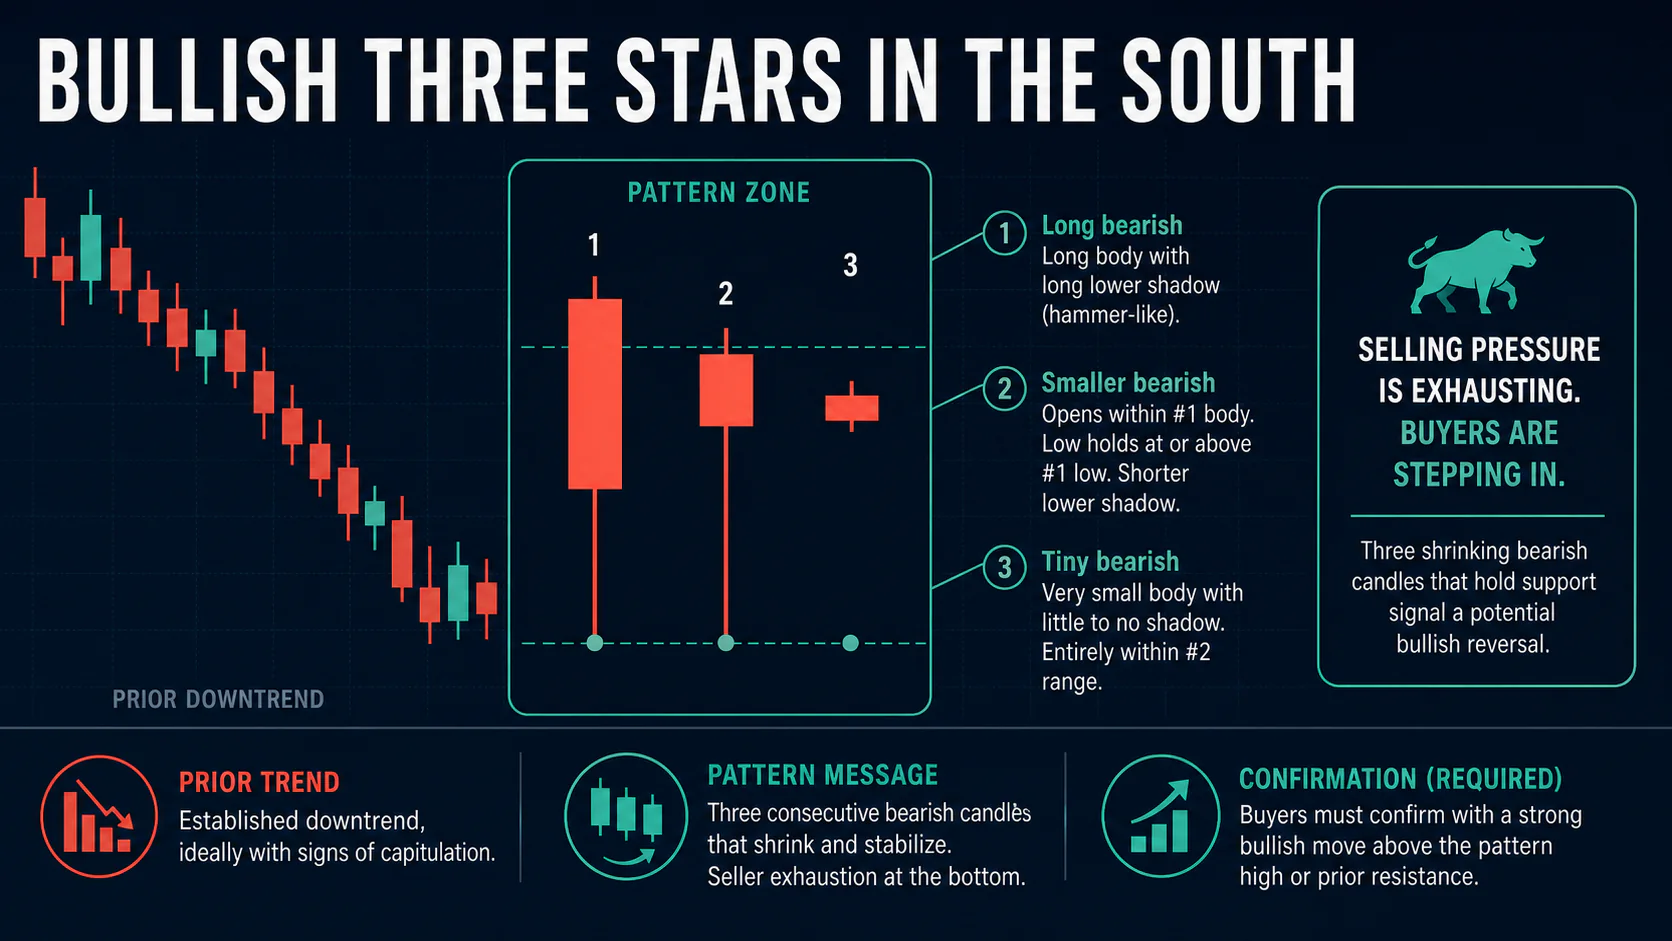
- First candle: a long black candle with a long lower shadow (similar in shape to a hammer), showing a session where sellers pushed price sharply lower but buyers stepped in before the close.
- Second candle: a smaller black candle that opens within the first candle's body and whose low holds at or above the first candle's low — it still has a lower shadow, but a shorter one than the first candle.
- Third candle: a very small black candle with little to no shadow (close to a marubozu), trading entirely within the second candle's range.
The key detail that's easy to get wrong: this pattern is not built on gaps down or a series of lower lows. It's the opposite — each candle's low holds steady or improves slightly compared to the one before it, while the real bodies and shadows shrink. That combination (still bearish in color, but no longer making real progress lower) is what signals exhaustion.
| Check | What to look for |
|---|---|
| Prior trend | Established downtrend, ideally with signs of capitulation |
| First candle | Long black body, long lower shadow (hammer-like) |
| Second candle | Smaller black body, low holds at/above first candle's low |
| Third candle | Very small black body, little to no shadow, contained in second candle's range |
| Gaps | Not required — candles typically open within or near the prior body |
Market Psychology
The first candle looks like a standard capitulation-style session: sharp intraday selling followed by a partial recovery, leaving a long lower shadow. The second candle shows sellers trying to continue the decline but failing to break meaningfully below the prior low — the lower shadow shrinks because there's less panic to recover from. By the third candle, sellers can barely move price at all; the small marubozu body reflects a near-standstill. Each candle is still nominally bearish, which is why the pattern doesn't flip to an obvious bullish shape, but the steadily shrinking ranges and stable lows tell the real story: the selling that drove the preceding decline has largely exhausted itself.
Variations
Long-shadow first candle: when the first candle's lower shadow is especially pronounced relative to its body, it suggests a more severe intraday reversal and can mark a more emphatic support level for the rest of the pattern to build on.
Extended sequence: occasionally a fourth or fifth progressively smaller black candle appears before the eventual bullish reversal, extending the same exhaustion process over a longer stretch.
Support-level formation: when the first candle's low coincides with an existing horizontal support level or long-term moving average, the exhaustion reading carries more weight than the same three candles appearing in open space.
Volume-declining formation: when volume clearly tapers off across the three candles — highest on the first, lowest on the third — it reinforces the exhaustion narrative more directly than a formation where volume stays flat or is inconsistent from candle to candle.
How It Differs From Similar Patterns
The first candle's long lower shadow resembles a standalone hammer, but a hammer is a single-candle signal that stands on its own, while here it's just the opening act of a three-candle sequence. The pattern is also easy to confuse with a simple string of small bearish candles marking a pause in a downtrend — what separates it is the specific combination of a hammer-like first candle, progressively shrinking bodies, and lows that hold rather than continuing to fall.
Trading the Pattern
Entry
Because the pattern itself is made entirely of bearish candles, most traders treat it as a setup rather than an immediate buy signal, and wait for a subsequent candle to close above the high of the three-star formation before entering.
Stop-Loss
Place a stop below the lowest point of the three-candle pattern (typically the first candle's low, including its shadow) — a break below that level means the exhaustion read was wrong. Because the pattern is rare and the preceding decline is often significant, some traders accept a somewhat wider stop than they would on a more common setup, given the potential size of the move if the reversal is genuine.
Profit Targets
Given the pattern's rarity and the depth of the preceding decline, resistance levels and Fibonacci retracements (38.2%, 50%, 61.8%) of the downtrend are reasonable reference points; there's no special measured-move rule specific to this pattern beyond standard reversal-target practice.
Confirmation
All three candles being bearish means confirmation matters more here than in patterns that end on an obviously bullish note. A subsequent candle closing above the high of the three-star formation is the standard trigger. If that confirming candle instead fails and price breaks below the pattern's low, the exhaustion read should be abandoned rather than defended — three small bearish candles without genuine follow-through don't validate themselves.
Combining With Indicators
Because the pattern requires an established downtrend to mean anything, checking that RSI or a similar oscillator is genuinely oversold going into the first candle helps confirm the setup is a real exhaustion pattern and not just a random string of small bearish candles. A hammer-like first candle forming at an existing support level adds further weight, and a stabilizing or rising volume pattern on the confirming candle (after volume that declined through the three stars) fits the exhaustion-then-reversal narrative the pattern describes.
Where It's Most Meaningful
Because the pattern hinges on subtle differences in shadow length and body size between consecutive candles, it is easiest to evaluate reliably on daily and weekly charts, where each candle reflects a full session or week of genuine trading activity. It also means more after an extended, well-established downtrend rather than a brief dip, since the entire premise depends on selling pressure having had time to build and then genuinely run its course.
Common Mistakes
- Requiring gap-downs between the candles. The pattern does not depend on gaps; requiring them will cause you to miss valid formations and misidentify others.
- Trading it before confirmation. All three candles are bearish — treating the pattern itself as a buy signal without waiting for a bullish follow-through candle is premature.
- Confusing it with a simple downtrend pause. The specific shrinking-body, holding-low structure is what defines this pattern; three random small black candles in a row don't automatically qualify.
- Overestimating how often it appears. This is one of the rarest named candlestick patterns — don't force a marginal formation into this label just because it has three black candles.
- Skipping the downtrend requirement. Three shrinking bearish candles appearing mid-uptrend, or in a sideways range, don't carry the same exhaustion implication described here.
FAQs
Why is a pattern made of three bearish candles considered bullish?
Because the substance of the pattern — shrinking ranges, stabilizing lows, and a fading lower shadow — shows sellers running out of momentum, even though every candle still closes lower than it opened. The signal is about exhaustion, not about the candles turning green.
Do the candles need to gap down from one another?
No. That's a common misconception. Each candle typically opens within or near the previous candle's body, and lows tend to hold rather than drop further.
How rare is this pattern really?
It's one of the least commonly cited candlestick patterns in practice — most traders will go long stretches without seeing a clean example on a given chart.
What confirms the reversal?
A subsequent candle that closes above the high of the three-star formation is the standard confirmation traders look for before acting.
How is this different from a hammer at the bottom of a downtrend?
A single hammer is a one-candle signal that can appear at any point a downtrend pauses. Three Stars in the South uses a hammer-like first candle as only the opening piece of a longer three-candle exhaustion sequence, which generally makes it a more specific — and much rarer — setup than spotting a hammer alone.
Conclusion
Three Stars in the South is a rare bottoming pattern built entirely from bearish candles that shrink in size while their lows stabilize — a sign that a downtrend's selling pressure has largely burned itself out even though the candles themselves haven't turned bullish yet. There's no gap-down requirement, and confirmation from a following bullish candle is what actually validates the reversal. Given how infrequently it appears in a clean form, treat it as a heads-up to watch closely rather than an automatic trade signal, and lean on the downtrend context and confirming candle just as much as the three stars themselves. Because clean examples are so infrequent, most of the practical value comes from knowing the correct structure well enough to recognize it immediately rather than mistaking an ordinary lull in selling for something more significant.