Bullish Long Legged Doji
Updated Aug 26, 2026
- Signal
- Bullish Reversal
- Reliability
- Low
- Rarity
- Common
- Confirmation
- Required
- Trend Position
- Downtrend Bottom
- Best Timeframes
- Daily+
On this page
A long-legged doji is a single-candle pattern with long shadows on both the top and bottom of the range while the open and close are nearly identical, so the real body sits in the middle of a wide trading range. Unlike the dragonfly or gravestone doji, it has no built-in directional bias: both sides of the market pushed price hard during the session and neither side won, leaving pure indecision. It only takes on a bullish or bearish reading from the trend it appears in and the confirmation that follows. This page covers its use as a possible bottoming signal after a downtrend.
Recognition Criteria
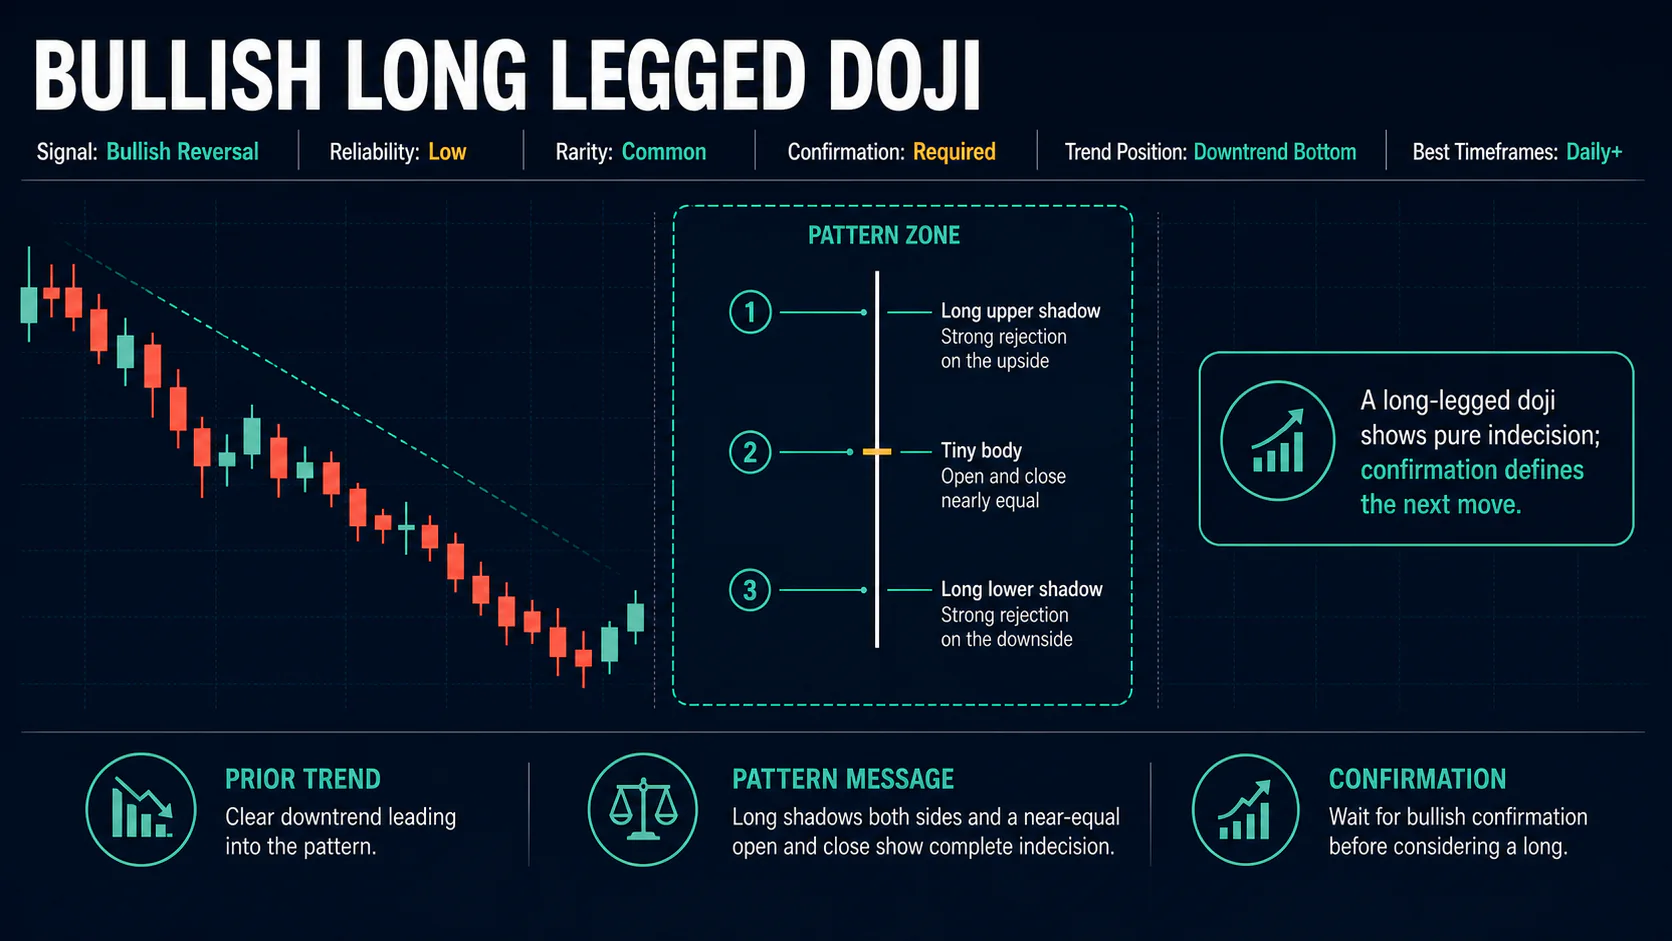
The session opens, and from there price is pushed substantially in both directions before settling back to close near the open. That two-way movement is what separates this pattern from a simple doji with only a small wick on one side: both the buyers and the sellers had a real chance to take control during the session, and neither one held it by the close.
Core Requirements
- Open and close nearly identical: the essential doji requirement.
- Long upper and lower shadows: both shadows should be substantial and roughly comparable in length, conventionally at least three to four times the tiny body, distinguishing it from a dragonfly (long lower shadow only) or gravestone (long upper shadow only).
- Wide total range: the session's high-to-low range should be noticeably larger than recent sessions, confirming genuine two-way volatility rather than a quiet, narrow doji.
- Trend context: the pattern must appear after a clear downtrend to be considered as a potential bullish signal at all; it carries no inherent bullish or bearish meaning on its own.
What Sets It Apart From Other Dojis
Because the dragonfly and gravestone doji each show a rejection in one direction only, they carry a built-in lean once you know which shadow is long. The long-legged doji deliberately has both, which is precisely why it does not get that same directional shortcut; recognizing it correctly means confirming that both shadows are genuinely substantial, not just that the candle happens to have some wick on each side.
Market Psychology
A Session of Conflict
Both buyers and sellers push price aggressively during the session, with prices swinging meaningfully higher and lower, yet the close ends up essentially where the session opened. That tells you the market tried to find direction and failed. Sellers had room to extend the decline and could not hold it; buyers had room to drive a rally and could not hold that either.
Reading It in a Downtrend
In an extended downtrend, this can mean that sellers, despite ample opportunity, could not sustain a new low, and buyers showed enough presence to defend the lower end of the range. It is a weaker signal than a directional rejection candle like the dragonfly doji precisely because it shows balance rather than a clear winner.
Why the Next Session Matters More Here
Because the candle itself does not pick a side, the direction the market takes immediately afterward carries more diagnostic weight for a long-legged doji than it does for a directionally biased pattern. A strong close in either direction the next session tells you far more than the doji itself does, which is part of why this pattern is rated lower on reliability than the dragonfly doji even though both are single-session dojis appearing in the same downtrend context.
Variations
Classic long-legged doji: open and close identical, with both shadows substantial and roughly symmetric.
Asymmetric long-legged doji: one shadow moderately longer than the other while both remain long enough to qualify, still valid, though the psychological reading leans slightly toward whichever side had the shorter shadow, since that is the side that ultimately held.
Support-level long-legged doji: forms at a well-tested support level, moving average, or Fibonacci retracement, adding technical confluence.
Range-expansion doji: the total high-to-low range is unusually wide relative to recent sessions, which is a more meaningful version of the pattern than one with a merely average range, since it shows a genuine spike in two-way activity rather than routine noise.
Market Context
Because the candle itself is directionally neutral, where and when it appears matters more than for most reversal patterns. It is most worth paying attention to after a mature, extended decline, ideally at or near a level that has acted as support before, and when broader volatility appears to be climaxing rather than just beginning. A long-legged doji that shows up early in a fresh downtrend, or far from any recognizable support, is closer to routine noise than a meaningful turning signal. It is also worth checking whether similar indecision is showing up on a higher timeframe, such as a weekly chart approaching a well-known level, since that context can lend more weight to what would otherwise be an unremarkable single session.
Trading the Bullish Long-Legged Doji
Entry
Wait for the following session to close above the doji's high with supportive volume before entering; because the pattern is directionally neutral by itself, confirmation matters more here than for a dragonfly doji or hammer. A gap up above the doji's high on the confirmation session is a stronger form of the same signal, since it shows buyers unwilling to even retest the prior day's range before pushing higher.
Stop Loss
Place stops below the doji's low. Given the wide range this pattern implies, allow a modest buffer for continued volatility rather than a very tight stop, and consider a time-based exit if confirmation has not appeared within a few sessions, since prolonged hesitation after the doji reduces its usefulness as a timing signal.
Profit Targets
Keep targets conservative and tied to the nearest resistance level. Some traders use the doji's total range as a rough projection from the confirmation breakout, but nearby resistance should take priority over a mechanical projection, particularly given the pattern's below-average reliability compared with a directional reversal candle.
Confirmation and Combining with Indicators
Because the candle itself carries no directional bias, lean on supporting context: deeply oversold RSI with bullish divergence, a MACD turn from oversold levels, and formation at a meaningful support level or major moving average. A related, more decisive pattern to compare against is the tri star, where three consecutive dojis appear rather than one, and studying the difference between the two is a useful way to see how repetition of indecision across sessions changes its significance.
Common Mistakes
Recognition Errors
- Assuming the pattern is inherently bullish rather than a neutral indecision candle whose meaning depends entirely on context.
- Accepting shadows that are not genuinely long on both sides; a small wick on one side does not qualify.
Trading and Risk Mistakes
- Trading it in a weak or absent downtrend, where it carries no reversal significance.
- Skipping confirmation, which matters more for this pattern than for directionally biased dojis.
- Setting stops too tight given the wide range the pattern implies, risking a premature exit on normal follow-through volatility.
FAQs
Is the long-legged doji bullish or bearish?
Neither, by itself. It signals indecision. It only becomes a candidate bullish signal when it appears after a downtrend and is confirmed by the following session's strength.
How is it different from the dragonfly or gravestone doji?
The dragonfly doji has a long lower shadow only (conventionally bullish at bottoms), and the gravestone doji has a long upper shadow only (conventionally bearish at tops). The long-legged doji has long shadows on both sides and no inherent directional lean.
Why does it appear often but still need confirmation?
It is a relatively common pattern precisely because volatile, indecisive sessions happen often; most of them are not meaningful turning points, which is why confirmation is essential before acting.
Does the size of the shadows matter?
Yes, the more balanced and substantial both shadows are, the more clearly the session represents a genuine two-way battle rather than noise.
Can this pattern appear in an uptrend?
The candle itself can appear in any trend, but it only carries the bullish-reversal reading discussed here when it follows a downtrend; in an uptrend the same shape simply reflects indecision without the bottoming implication.
Is it ever worth trading without waiting for the next session?
Given how weak the pattern's reliability is on its own, most traders find it not worth acting on until confirmation appears, treating the doji itself purely as a signal to watch the stock more closely rather than as a trade trigger.
Conclusion
The long-legged doji marks a session of real conflict between buyers and sellers that ends in a draw. On its own it says nothing about direction; its value comes from where it appears, ideally after an extended downtrend and near support, and from what happens in the sessions that follow.
Treat it as an early warning to watch closely rather than a signal to act on immediately, and let the market's next move, not the doji itself, do the talking.