Bullish Rising Three Methods
Updated Aug 26, 2026
- Signal
- Bullish Continuation
- Reliability
- Moderate
- Rarity
- Common
- Confirmation
- Recommended
- Trend Position
- Mid-Trend
- Best Timeframes
- Daily+
On this page
Rising Three Methods is a five-candle continuation pattern that appears during an uptrend and signals that a brief pullback is over and the prior advance is likely to resume. A long bullish candle is followed by three small candles that drift lower but stay within the first candle's range, and then a final long bullish candle closes at a new high. It's essentially a chart-level way of showing that a pause didn't change the trend.
How to Recognize the Pattern
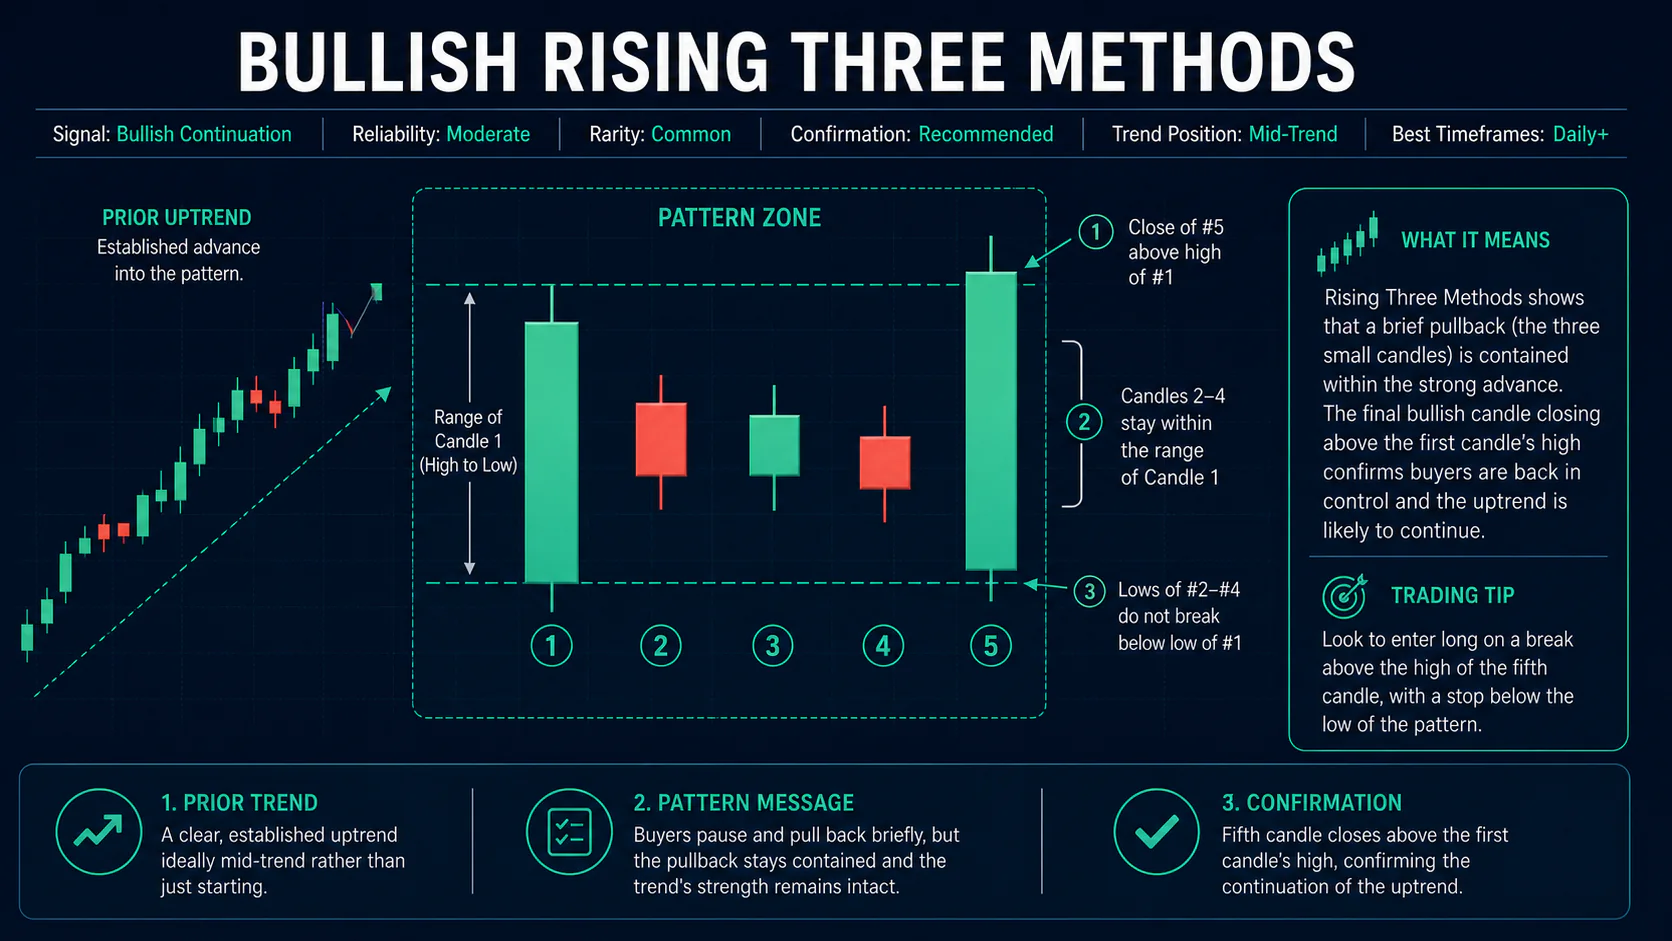
- First candle: a long bullish candle continuing the uptrend, with a substantial real body.
- Second, third, and fourth candles: three small-bodied candles (bullish or bearish) that stay contained within the first candle's high-to-low range. These represent the pullback or pause.
- Fifth candle: a long bullish candle that closes above the high of the first candle, confirming the uptrend has resumed.
The three middle candles staying inside the first candle's range is the defining constraint — if any of them closes outside that range (especially below the first candle's low), the pattern is broken and you're likely looking at a real reversal instead of a pause.
| Check | What to look for |
|---|---|
| Prior trend | Established uptrend, ideally mid-trend rather than freshly starting |
| First candle | Long bullish body, minimal upper shadow |
| Middle candles | Three small bodies contained within the first candle's high-to-low range |
| Fifth candle | Closes above the first candle's high |
Market Psychology
The first candle shows continued bullish conviction. The three small candles that follow represent normal profit-taking and hesitation — some early buyers lock in gains, some new buyers wait for a better entry — but none of that selling is strong enough to push price back below where the advance started. The final candle shows that the pullback has run its course: fresh buying (or the return of the original buyers) pushes price to a new high, absorbing whatever selling occurred during the pause. The pattern's usefulness comes from that contrast — a trend that survives a multi-day pause without giving up its gains is showing real strength, not just short-term momentum.
Variations
Tight consolidation: when the three middle candles trade in an especially narrow range, the eventual breakout on the fifth candle tends to be sharper.
Extended consolidation: the pause sometimes runs four or five candles instead of three before the breakout candle appears; the same logic applies as long as the middle candles stay contained. Longer pauses can also indicate a more thorough absorption of profit-taking before the trend resumes, though a pause that runs too long starts to blur into ordinary sideways consolidation rather than a brief, well-defined pattern.
Doji in the middle: one of the pullback candles appearing as a doji simply adds a touch more indecision to the pause without changing how the pattern resolves.
How It Differs From Similar Patterns
Rising Three Methods sits alongside Upside Gap Three Methods as one of the more common "pause and continue" candlestick structures — the two differ mainly in whether the pause happens gradually (three small candles drifting within a range) or around a gap that gets partially tested. Both contrast with reversal patterns like Three White Soldiers, which appear at trend bottoms rather than confirming an existing advance.
Trading the Pattern
Entry
The straightforward entry is on a close above the first candle's high (the fifth candle's close). More active traders sometimes scale in during the pullback candles if the pattern looks to be forming correctly, adding on confirmation.
Stop-Loss
A stop below the low of the pullback candles is the tighter option; a stop below the first candle's low is more conservative and gives the trade more room. If the pullback candles cluster near a moving average or prior support level, that level can serve as a cleaner reference than the raw candle low.
Profit Targets
Project the height of the first candle upward from the breakout point as a baseline, and use nearby resistance, prior highs, or Fibonacci extensions (127.2%, 161.8%) for further targets. If the stock is in a defined channel, the upper channel boundary is a reasonable objective.
Confirmation
The fifth candle's close above the first candle's high is the pattern's own confirmation step. Beyond that, watching whether the breakout holds over the following sessions — rather than immediately drifting back into the prior consolidation range — helps distinguish a genuine continuation from a false breakout that briefly pokes above resistance before failing.
Combining With Indicators
The pattern is more convincing when price holds above a key moving average (such as the 20- or 50-day) throughout the three pullback candles, and when RSI stays in bullish territory (above roughly 40) during the pause rather than dropping into oversold. Declining volume during the pullback followed by an increase on the breakout candle is a helpful secondary confirmation, and a MACD histogram that stays positive (even if shrinking) during the pause supports the idea that the underlying trend never really lost control.
Where It's Most Meaningful
Because the pattern depends on a clean containment relationship across five candles, it's easier to evaluate reliably on daily charts than on very short intraday timeframes, where similar-looking pauses can form from ordinary noise. It also tends to work better when the uptrend it interrupts has already shown some durability — a pattern forming a few sessions into a brand-new, untested advance carries less weight than one forming after a well-established trend has already proven itself. It also tends to be more dependable in liquid, actively traded names, where the pullback candles reflect broad participation stepping back rather than the absence of any real trading at all.
Common Mistakes
- Allowing the middle candles outside the range. If a pullback candle closes below the first candle's low, the pattern's core premise — that the trend was never seriously threatened — no longer holds.
- Trading it against the broader trend. This is a continuation pattern; it doesn't apply at market bottoms or in downtrends.
- Entering before the fifth candle confirms. Jumping in during the pullback assumes the pattern will complete correctly, which isn't guaranteed.
- Ignoring how long the pause has run. A pullback that drags on well beyond three to five candles starts to look more like genuine consolidation or distribution than a brief pause.
- Trading a fresh, unproven uptrend the same as a mature one. The pattern's premise — that the trend survived a real test — carries more weight when the uptrend has already shown some staying power.
FAQs
Do the three middle candles need to be small?
Yes — small relative to the first candle's body is part of the definition. Large middle candles suggest real contention for control, not a minor pause.
Can the middle candles be bullish instead of bearish?
Yes. Their color doesn't matter as much as their size and the fact that they stay within the first candle's range.
What breaks the pattern?
Any middle candle closing outside the first candle's high-to-low range, or the fifth candle failing to close above the first candle's high.
Is this the same as a bull flag?
They're closely related concepts — both describe a brief pause within an uptrend followed by continuation — but Rising Three Methods is a specific five-candle structure with strict containment rules, while a bull flag is a broader chart-pattern concept without the same candle-by-candle definition.
Does the pattern require declining volume during the pause?
It's a supportive signal but not a strict requirement. The core definition rests on price containment across the middle candles; volume characteristics add confidence rather than define the pattern.
Conclusion
Rising Three Methods is a practical, common continuation pattern: a strong candle, a contained pause, and a breakout candle that confirms the trend never really broke. Because it trades with the existing trend rather than trying to call a reversal, it tends to fit naturally into a broader trend-following approach — the main discipline required is confirming that the pullback candles actually stayed inside the first candle's range before trusting the breakout. Because the pattern is common, it's tempting to trade every instance that appears — but reserving it for uptrends that already have some track record, and requiring a genuine close above the first candle's high rather than a marginal poke through it, filters out a meaningful share of the weaker setups.