Bullish Engulfing
Updated Aug 26, 2026
- Signal
- Bullish Reversal
- Reliability
- High
- Rarity
- Common
- Confirmation
- Recommended
- Trend Position
- Downtrend Bottom
- Best Timeframes
- Daily+
On this page
A bullish engulfing pattern is a two-candlestick reversal signal that appears after a downtrend. The first candle is bearish; the second is a bullish candle whose real body completely engulfs the first candle’s real body — its open is at or below the first candle’s close, and its close is at or above the first candle’s open. The shadows don’t need to be engulfed, only the bodies, though many strong examples cover the full range as well.
Recognition Criteria
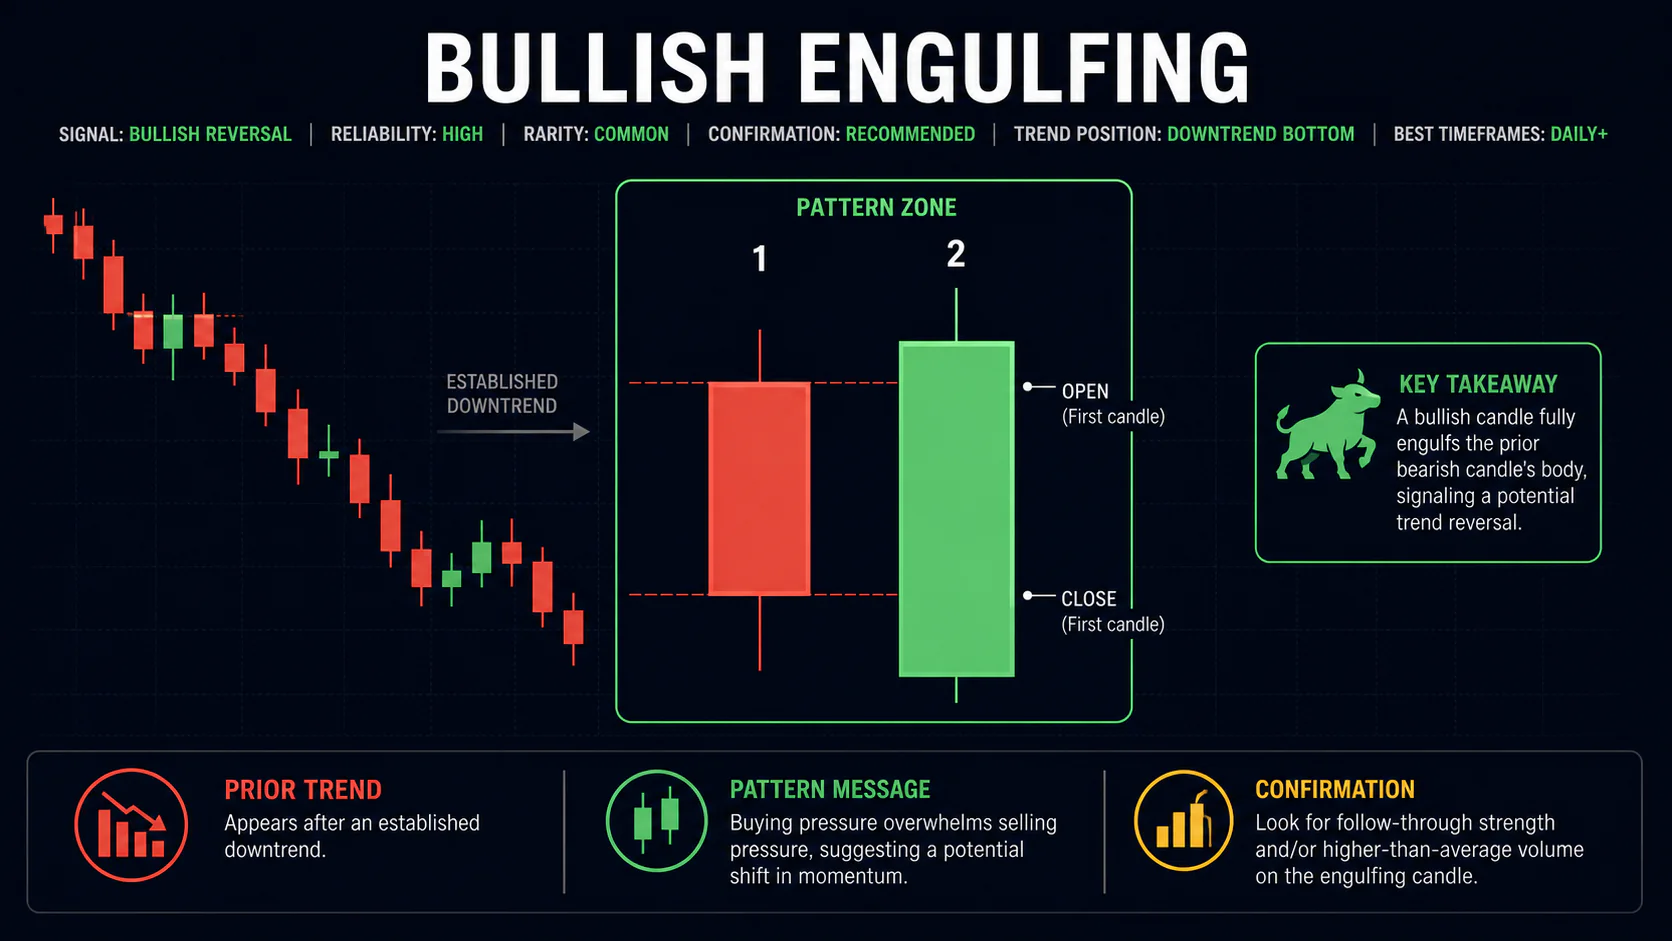
First candle: A bearish candle that continues the existing downtrend. It doesn’t need to be unusually large — it simply needs to represent ongoing selling pressure.
Second candle: A bullish candle whose real body completely contains the first candle’s real body. This is the defining requirement: engulfment applies to the open-to-close range of each candle, not necessarily the high-to-low range including shadows.
- The pattern must appear after an established downtrend, not during consolidation or a minor pullback
- The second candle’s body must fully contain the first candle’s body
- A larger engulfing candle relative to the first candle generally signals a more decisive shift in sentiment
- Higher-than-average volume on the engulfing candle is a useful, though not required, supporting signal
Market Psychology
The first candle represents the tail end of seller control — a continuation of the prevailing bearish sentiment. The second candle represents an abrupt reversal: buyers absorb whatever selling remains from the prior session and push price beyond the first candle’s entire body, closing above where sellers had been comfortable. That combination — one session of continued bearish control immediately followed by a session that fully reverses it — is what gives the pattern its psychological weight. A larger, more complete engulfment, especially on higher volume, suggests the shift in control was more decisive.
Variations
An engulfing candle that is two to three times the size of the first candle, or one that also swallows the first candle’s shadows (a full-range engulfing), is generally viewed as a stronger version of the pattern. When the first candle is a doji or has a very small body, the subsequent engulfment carries extra weight because it resolves clear indecision with a decisive move. None of these variations change the core definition — they’re simply degrees of the same signal.
Trading the Bullish Engulfing
Entry
Many traders enter as soon as the engulfing candle closes, since the pattern is already complete at that point. More conservative traders wait for the following session to confirm continued upward movement, sacrificing some of the initial move for additional validation. A pullback toward the engulfing candle’s low can also offer a lower-risk entry when it occurs without breaking the pattern’s structure.
Stop-Loss
The most common stop placement is below the first candle’s low, since a move back below that level would call the reversal thesis into question. Tighter stops below the engulfing candle’s own low reduce risk per trade but increase the chance of being stopped out by normal volatility.
Targets
Nearby resistance — a prior swing high, a moving average, or a round number — is the most realistic first target. Some traders project the height of the engulfing candle upward from the pattern’s high as a rough measured-move estimate, taking partial profits at intermediate resistance along the way.
Confirmation
Because the pattern is already a completed two-candle formation, confirmation is optional rather than required, but it still adds value: a follow-through session that holds above the engulfing candle’s low, ideally on continued volume, shows the reversal has staying power rather than being a one-session event.
Combining With Indicators
An engulfing pattern that forms while the RSI is below 30, or while price sits at a Fibonacci retracement level or a major moving average, carries more weight than one appearing in open space. A bullish MACD crossover developing around the same time offers an additional, independent read on momentum. As always, these tools provide context — they don’t change what the candlestick pattern itself requires.
Common Mistakes
- Accepting patterns where only the closing prices overlap favorably, without verifying that the second candle’s body truly contains the first candle’s entire body
- Requiring the second candle to engulf the first candle’s shadows as well — a stronger variant, but not part of the base definition
- Trading engulfing patterns that form during sideways markets or minor pullbacks rather than after a genuine downtrend
- Ignoring volume entirely, which can help distinguish a conviction-driven reversal from a low-participation bounce
FAQs
Does the second candle need to open below the first candle’s low?
No. The requirement is that the second candle’s body engulfs the first candle’s body — its open at or below the first candle’s close, and its close at or above the first candle’s open. Opening below the prior low is common in a strong example but isn’t part of the definition.
Do the shadows need to be engulfed too?
No. Only the real bodies matter for the pattern to qualify. A version that also engulfs both shadows is a stronger, more complete signal, but it isn’t required.
How is this different from a bullish harami?
They’re near opposites in structure. In a bullish engulfing pattern, the second candle’s body is larger and contains the first. In a bullish harami, the second candle’s body is smaller and sits inside the first candle’s body.
Is a bullish engulfing pattern always a strong buy signal?
It’s considered one of the more reliable candlestick reversal signals, but no single pattern guarantees an outcome. Context — trend, volume, and nearby support or resistance — matters as much as the shape of the two candles.
Conclusion
The bullish engulfing pattern is a straightforward, frequently occurring two-candle reversal signal: a bearish candle followed by a bullish candle whose body completely contains it. Its clarity and relative frequency make it one of the more practical reversal patterns to learn, but like any candlestick signal it works best alongside real support levels, sensible volume analysis, and a risk management plan rather than in isolation.